
NHL Stats Leaders 2025–26 (Live Updates)
NHL Stats Leaders 2025–26 (Live)
Looking for up-to-date NHL stats and current NHL scoring leaders? Below you’ll find leaders for points, goals, assists, goalies (SV% & GSAx), plus special-teams context and how it all ties to the NHL standings. Updated frequently.
Tip: Click any section title to jump via the table of contents (anchors are auto-generated).
Scoring Leaders (Points)
The top players by points (PTS), with games played (GP) and points-per-game (PPG) context. Full list on the main leaderboard.
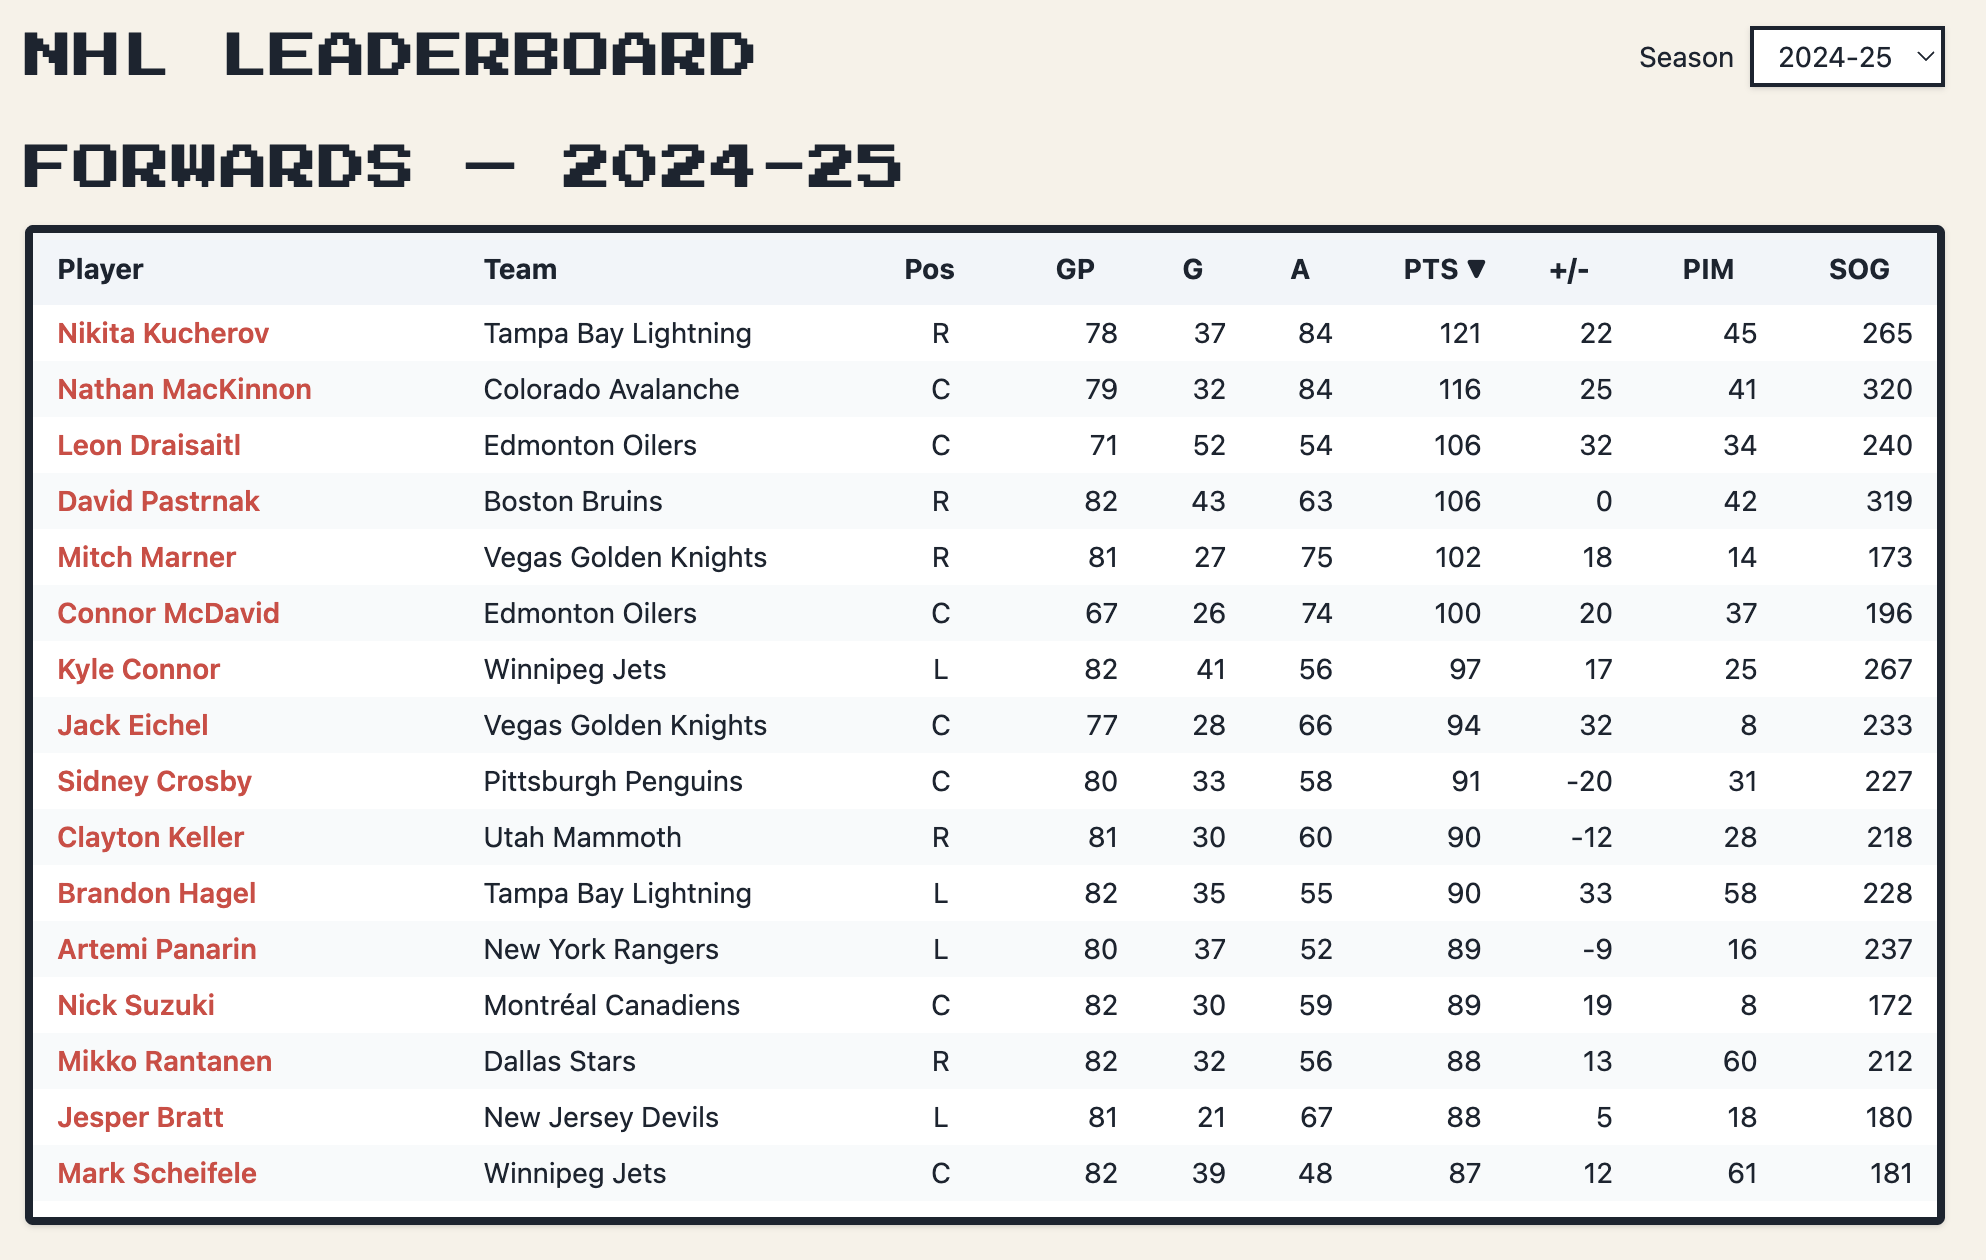
Why it matters: Points combine goals and primary/secondary assists, giving the cleanest snapshot of overall production.
Goal Leaders
Pure finishers. Use this alongside our shot maps to see where the best scorers generate chances.
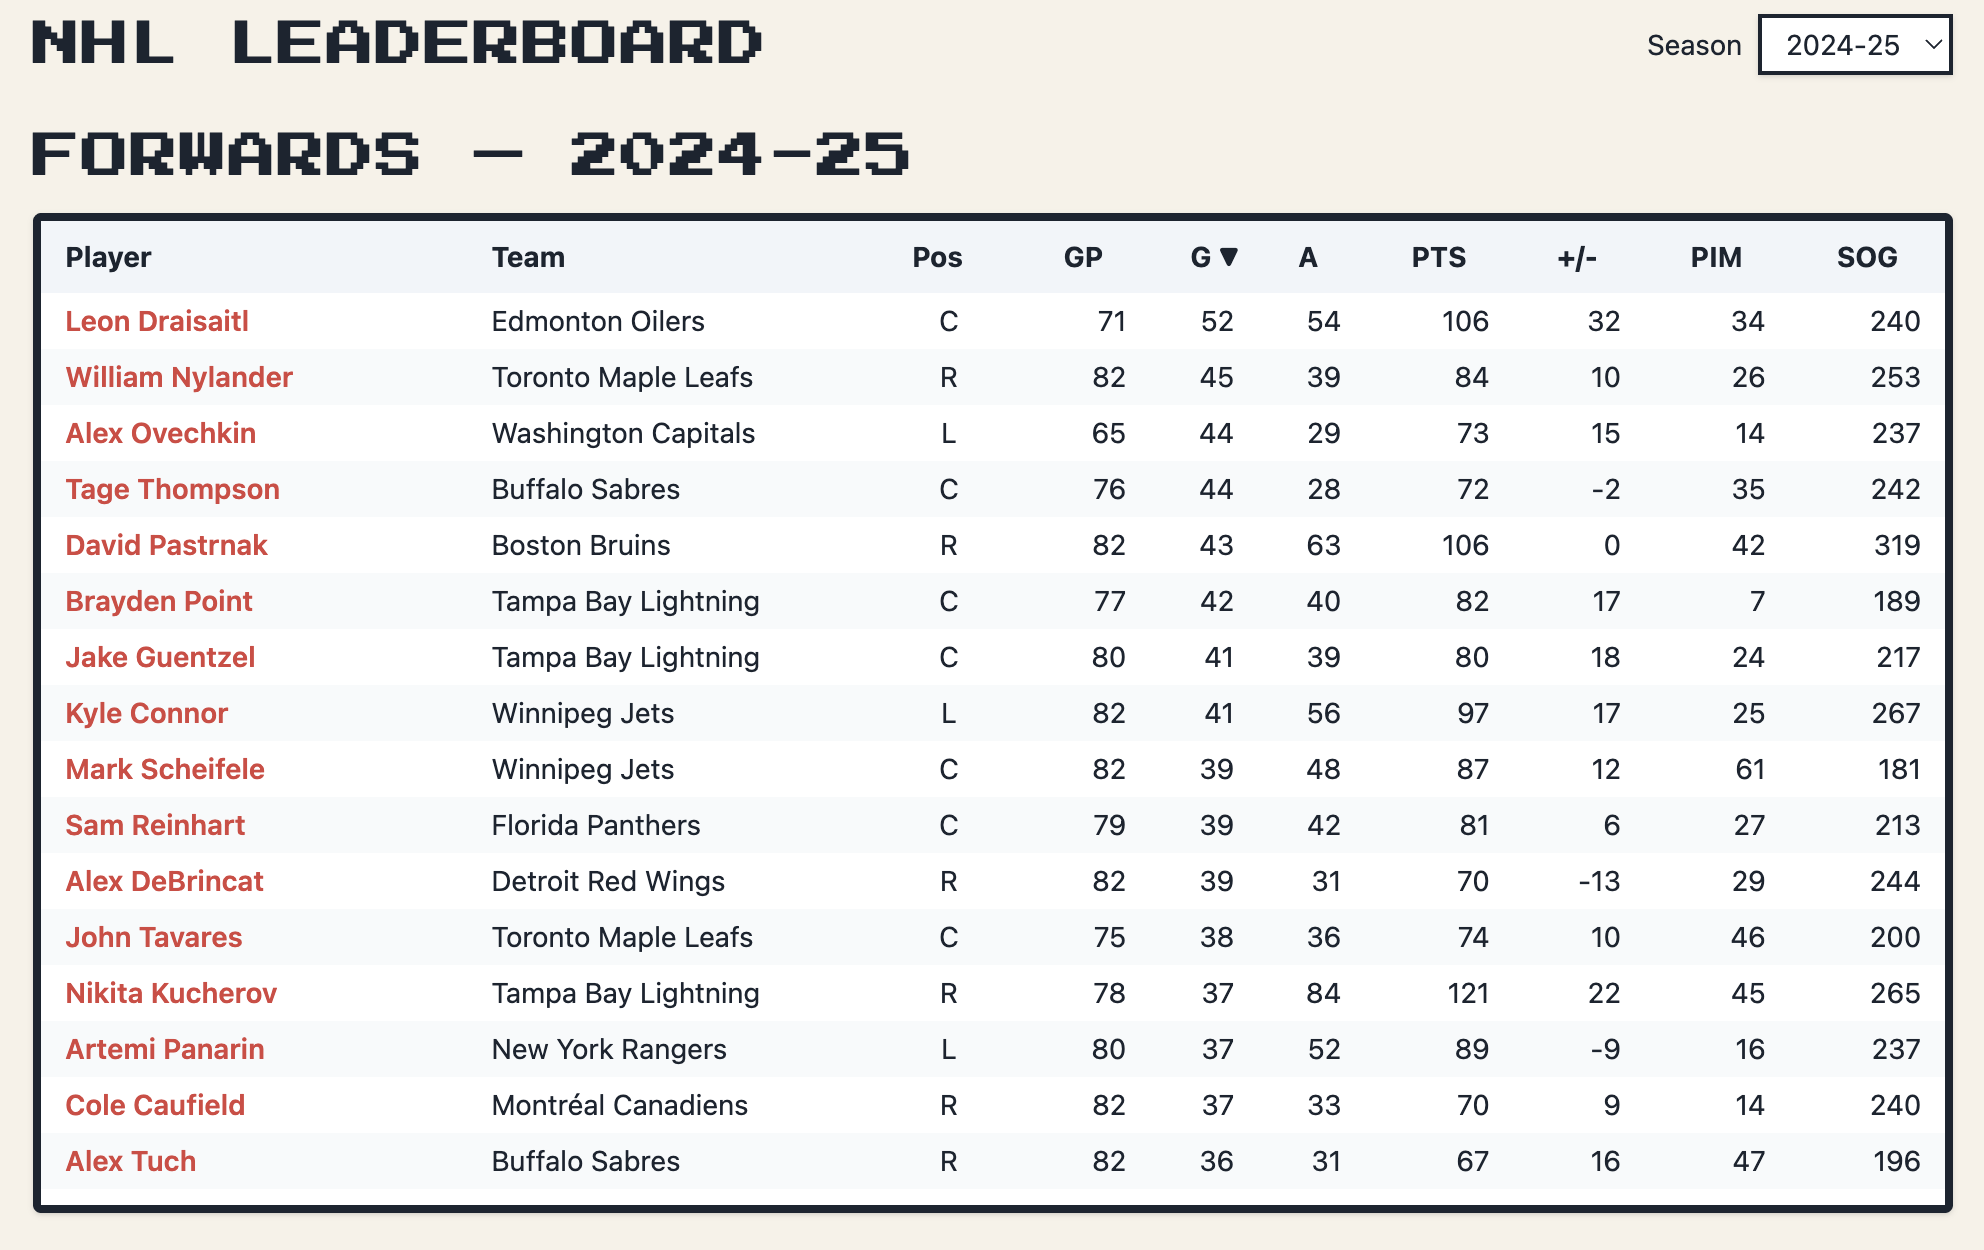
Micro-trend: Volume shooters with heavy PP usage tend to sustain elite goal rates over long stretches.
Assist Leaders
Playmaking drives 5-on-5 offense and power-play sequencing.
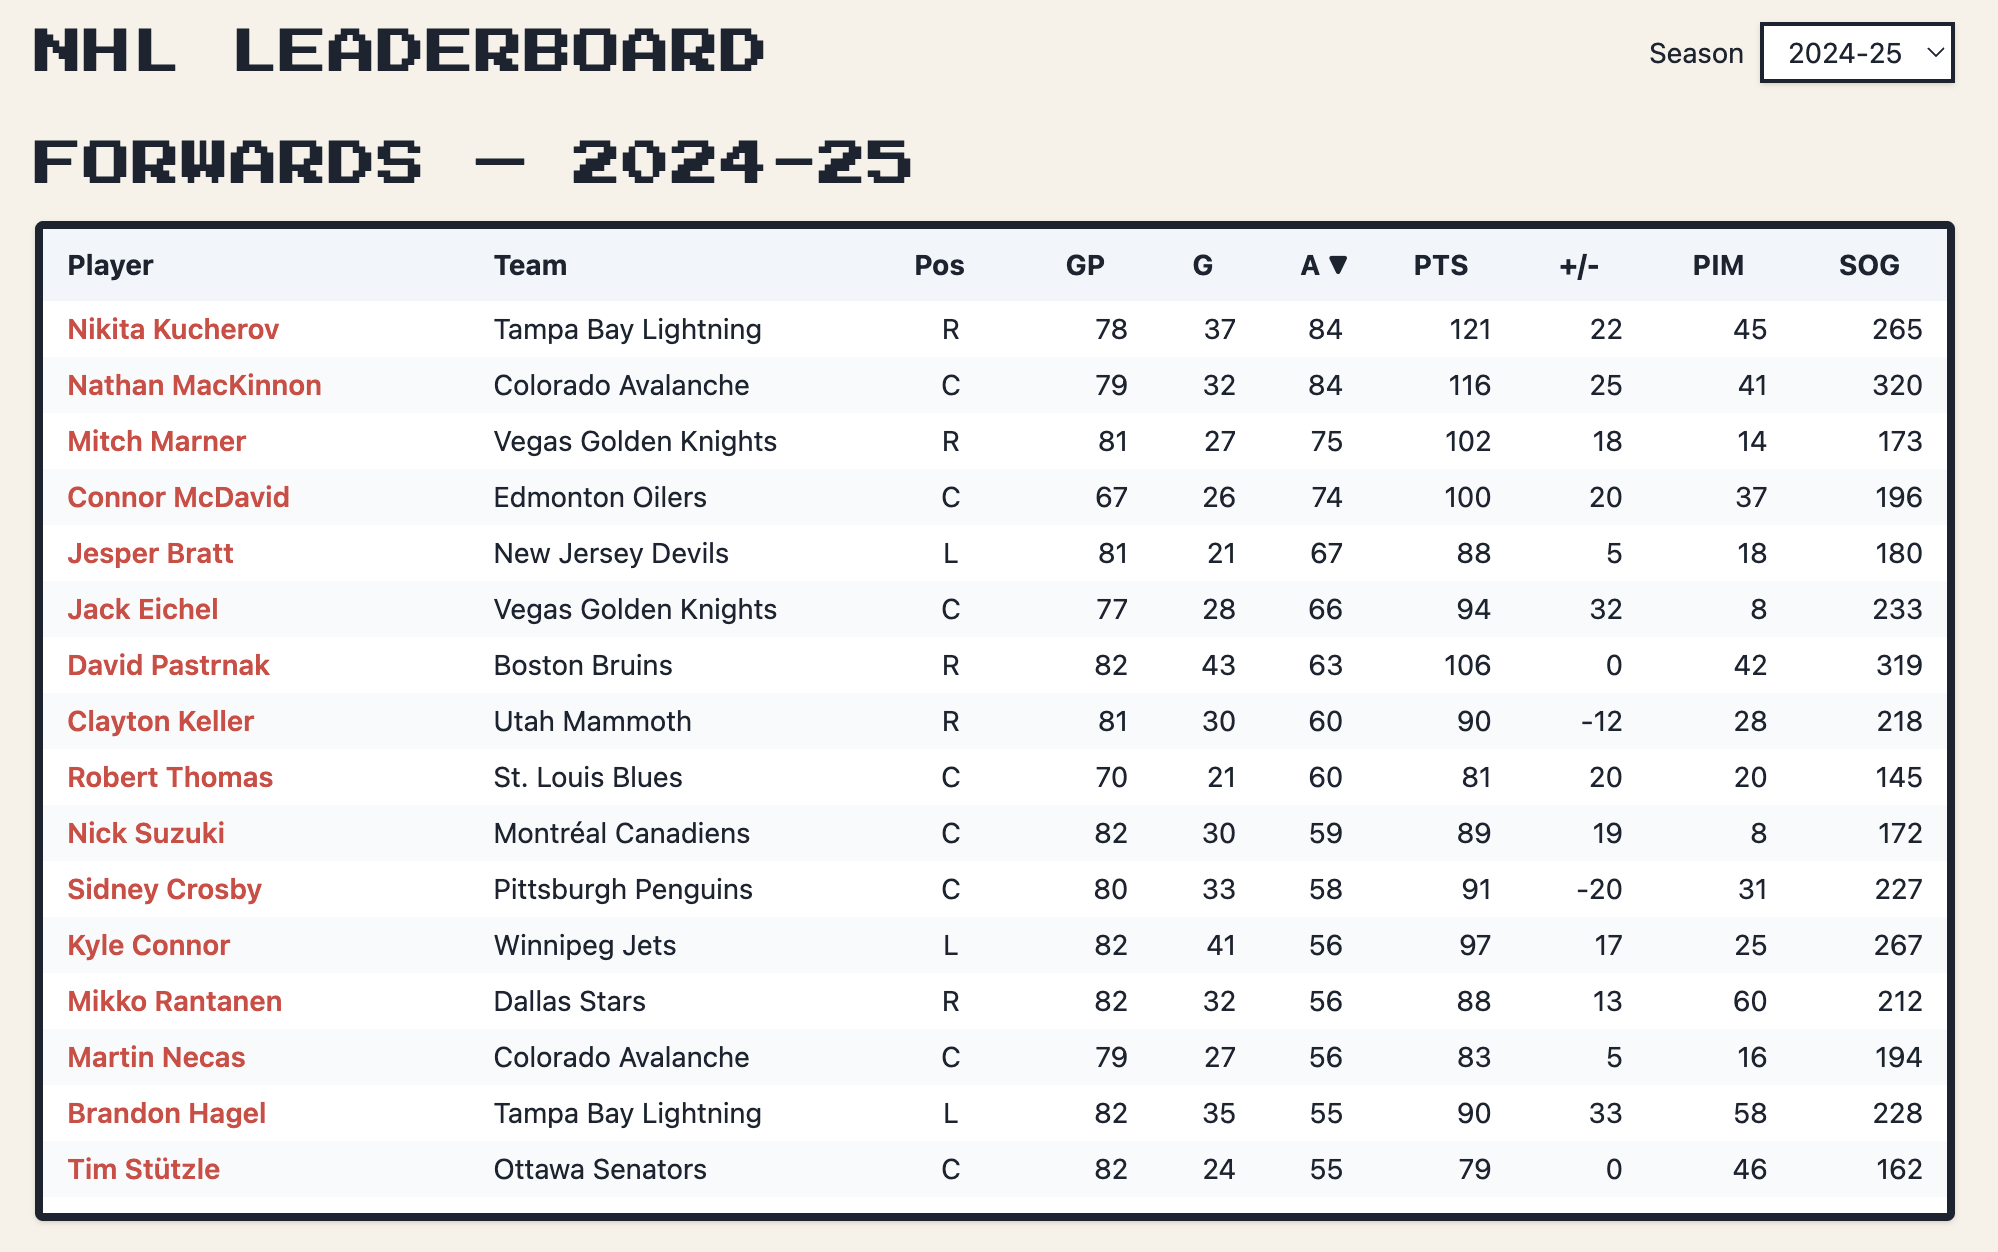
What to watch: Primary assists correlate more with repeatable playmaking than secondaries; we surface both in player pages.
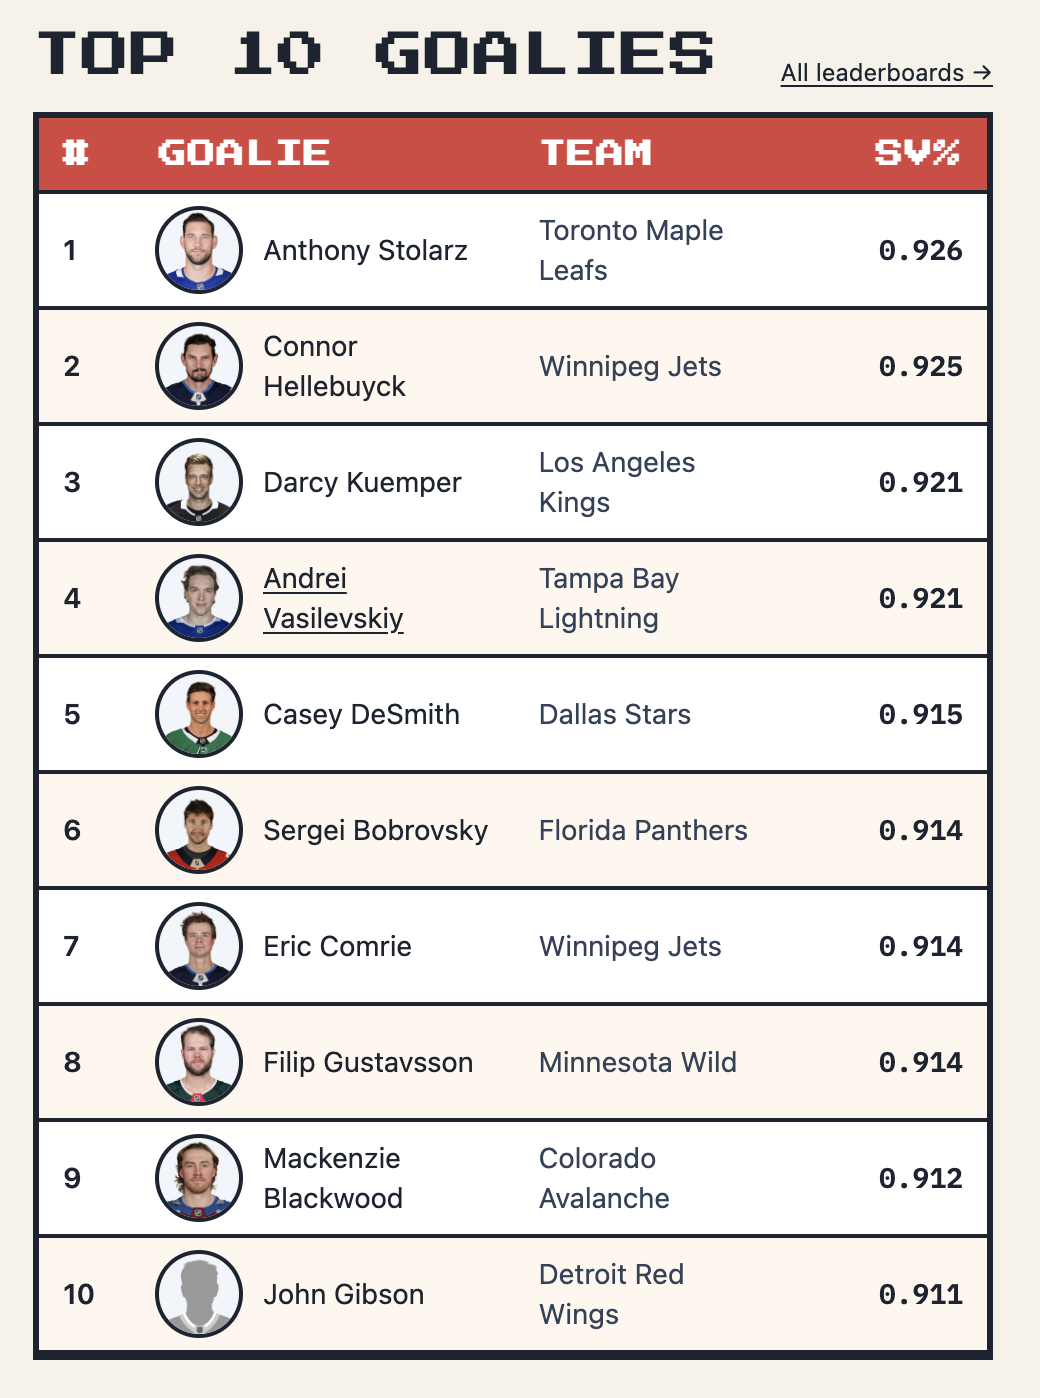
Goalie Leaders (SV% & GSAx)
We highlight save percentage (SV%), Goals Saved Above Expected (GSAx), and shutouts (SO). Minimum starts threshold applied to reduce noise.
Glossary:
- SV% – share of shots stopped.
- GSAx – goals prevented vs. expected, adjusting for shot quality.
- SO – shutouts.
Special Teams Leaders (PP & PK)
Power-play efficiency (PP%) and penalty-kill suppression (PK%) swing tight games.
Full special-teams leaderboard →
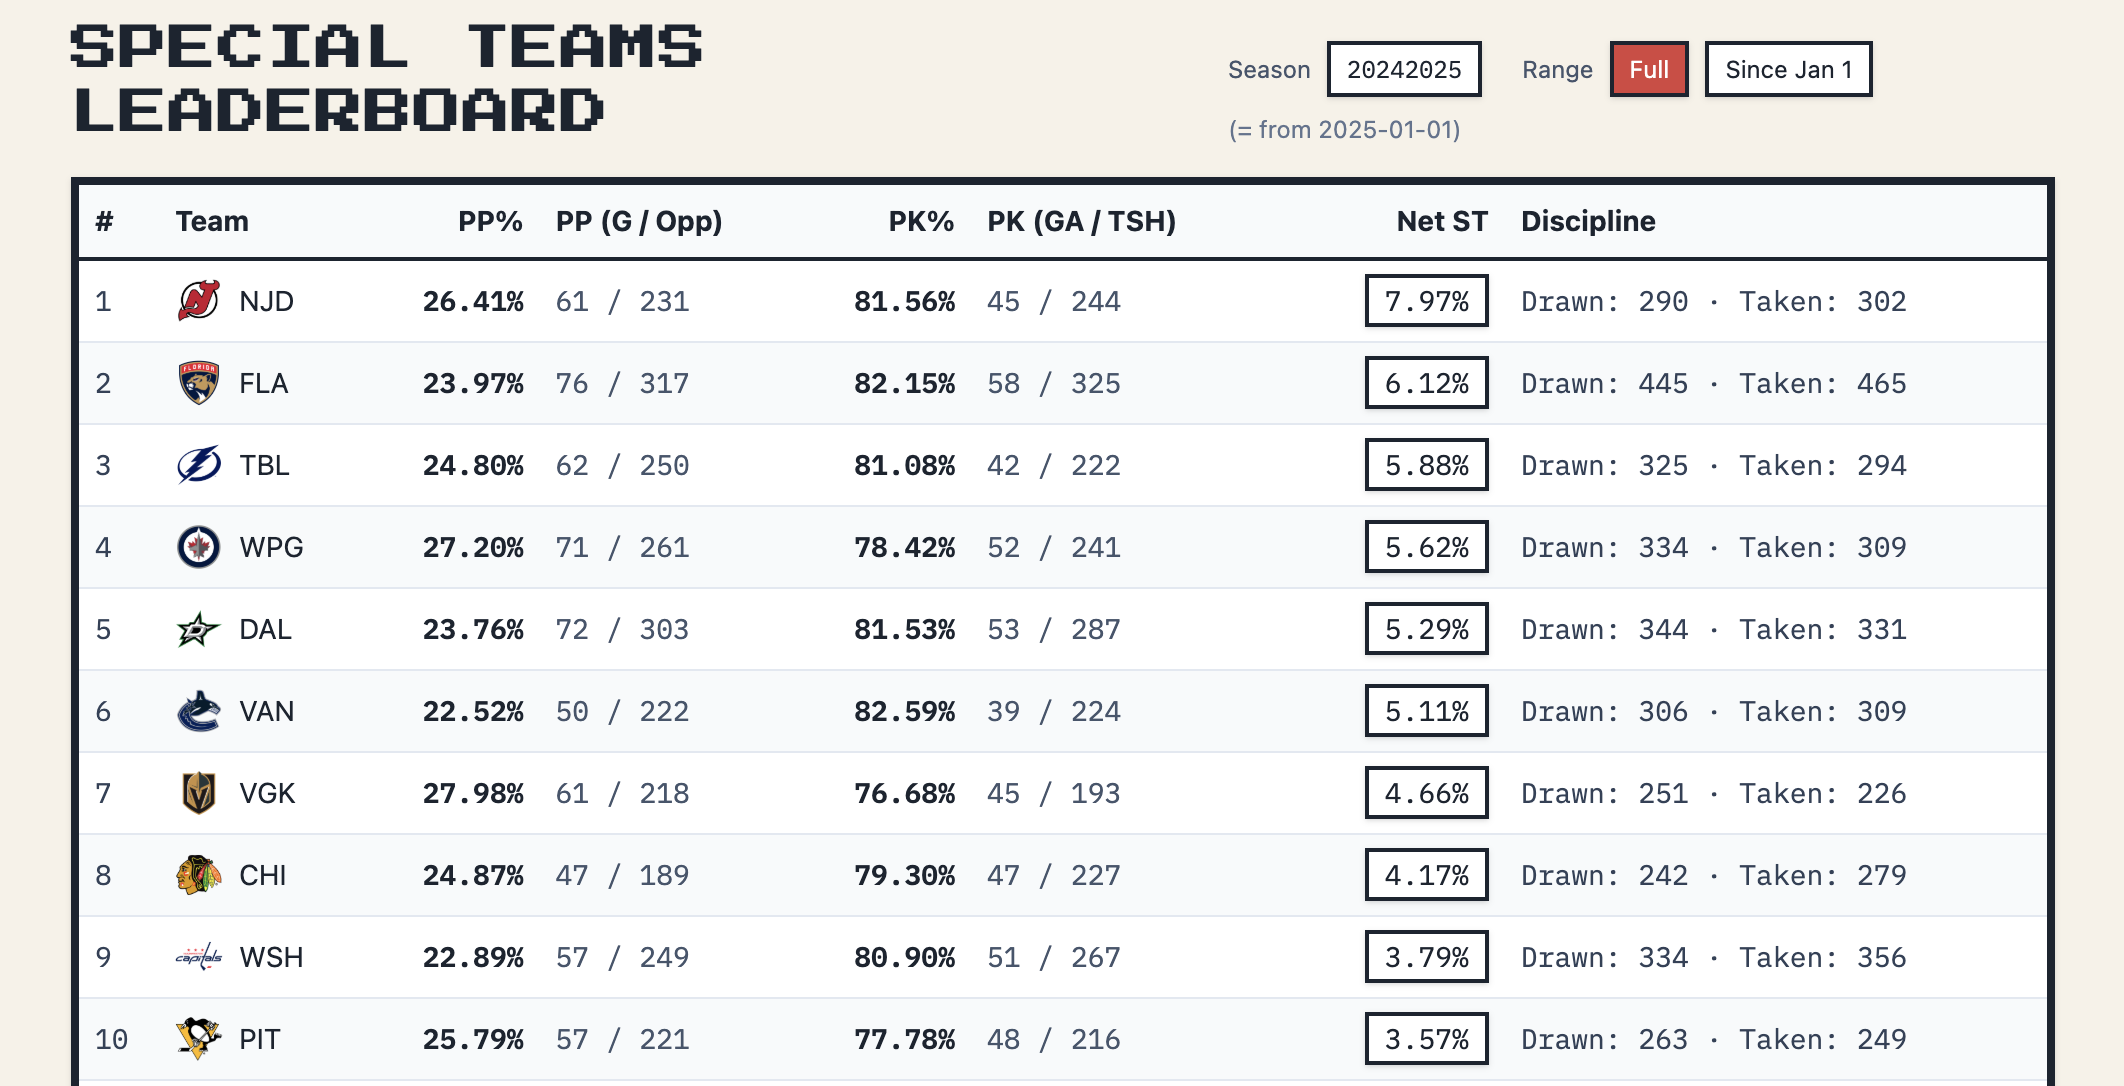
Net ST combines PP% and PK% into one quick read on special-teams edge.
Standings Context
Elite individual production often shows up in the NHL standings via goal differential and special-teams edges. Teams with top-10 PTS leaders and top-10 Net ST typically sit in playoff seeds by mid-season.
Methodology & Updates
- Source & refresh: Data ingested from NHL game feeds and refreshed frequently during the season.
- Filters: Goalie leaderboards apply a minimum GP/starts threshold to avoid small-sample noise.
- Definitions: Points = G + A; PPG = PTS / GP; GSAx via shot-quality model.
- Season toggle: Use the controls on each leaderboard page to switch seasons and ranges (e.g., Since Jan 1).
Questions? See the FAQ below or ping us—feedback helps us improve the models and visualizations.
FAQ
How often are these NHL stats updated?
Multiple times per day during the season, including after game finals.
What is GSAx, in plain English?
It estimates how many goals a goalie prevented vs. what an average goalie would have allowed, given the quality and quantity of shots faced.
Why does your top 10 differ from some sites?
Inputs and thresholds differ (e.g., minimum games, 5-on-5 weighting, empty-net handling). We document assumptions on each leaderboard page.
Can I filter by date range (e.g., since Jan 1)?
Yes — most leaderboards include a range control (Full season vs. since a date).
If you’re writing or streaming about the league and need a specific view/table, message us—happy to help.