
Understanding NHL Goalie Save Percentage
When it comes to measuring a goalie's pure performance, save percentage is the king of all stats. It tells you, in the simplest terms, what percentage of shots a goalie stops. This one number offers a crystal-clear picture of their effectiveness, cutting through the noise of team performance.
Why Save Percentage Is a Goalie's True Measure
In hockey, not all stats are created equal. Wins are what everyone chases, but they often say more about the team—from the star forwards to the shutdown defencemen—than the person in the crease. A goalie on a powerhouse team might rack up wins while barely breaking a sweat. Meanwhile, a world-class netminder on a struggling team could post amazing numbers night after night, only to end up with a loss.
This is where NHL goalie save percentage becomes the great equalizer.
Think of it like a quarterback's completion percentage. It doesn’t care about the final score; it only measures how well the player did their primary job on a per-attempt basis. For a goalie, that job is stopping the puck. Save percentage isolates this core responsibility, giving us a raw measure of their skill and consistency.
Isolating Individual Performance
The real beauty of this metric is its ability to separate a goalie’s contribution from their team's defensive structure. A team that bleeds high-danger scoring chances forces its goalie to be a hero. A netminder who consistently posts a high save percentage under that kind of fire is showing off some serious skill.
This allows analysts, scouts, and fantasy managers to spot talent that might otherwise be overlooked. A goalie with a .915 save percentage on a last-place team is often way more impressive than a goalie with a .905 on a division winner. The stat tells a story that a simple win-loss record just can’t.
Save percentage provides a direct answer to the most important question: When a shot was taken, how often did the goalie stop it? This simplicity is its greatest strength, making it the bedrock of modern goaltender analysis.
A Reliable Indicator of Skill
Unlike Goals Against Average (GAA), which can get skewed by a team's defensive scheme or a high volume of shots, save percentage stays remarkably stable. It focuses purely on the battle between the shooter and the goalie.
For example, a goalie might let in four goals but make 46 saves on 50 shots. Their resulting .920 SV% reveals a brilliant performance that a bloated GAA would completely hide.
This focus on per-shot performance makes it an invaluable tool for:
- Evaluating Talent: Scouts use it to find diamonds in the rough, regardless of their team's record.
- Fantasy Hockey: Smart managers draft goalies who face a ton of rubber but maintain a high save percentage, maximizing points from saves.
- Predictive Analysis: It helps signal when a goalie is on a heater or heading for a slump, offering insights for betting and game predictions.
Ultimately, save percentage cuts through all the team-related clutter. It offers the clearest, most direct assessment of a goaltender’s ability to do their job, making it the foundational metric for any serious hockey analysis.
How to Calculate Goalie Save Percentage
Calculating a goalie's save percentage is refreshingly simple. You only need two numbers: the shots a goalie faced and how many of them they stopped. That simplicity is what makes it one of the most powerful and widely used stats in hockey, whether you're a seasoned analyst or a fan watching on the couch.
At its heart, the formula is just a basic division problem that tells you how effective a goalie was on any given night.
The Formula for Save Percentage (SV%):
Total Saves / Total Shots Against = Save Percentage
Let's say a goalie makes 29 saves on 30 shots. You just divide 29 by 30, which gives you 0.9666.... In hockey, we round that to three decimal places, giving the goalie a stellar .967 SV% for the game. That single number tells the whole story: they stopped 96.7% of the pucks that came their way.
Putting the Calculation into Practice
Let's look at two different game scenarios to see how the numbers paint a picture.
Scenario A: A goalie has a relatively quiet night, facing 30 shots and allowing only one goal. That's 29 saves, giving them a .967 SV% (29 saves / 30 shots).
Scenario B: Another goalie is under siege, facing 48 shots and letting in three. They made 45 saves, resulting in a .938 SV% (45 saves / 48 shots).
While the goalie in Scenario B allowed more goals, a .938 SV% on 48 shots is an incredible performance. It shows a goalie standing on their head, weathering a storm and keeping their team in the fight. This is a perfect example of why save percentage is often a better measure of a goalie's performance than just looking at goals against.
The table below breaks down a few more examples to show how different shot and save totals translate into the final percentage.
Sample Save Percentage Calculations
This table shows how different shot and save totals in a single game translate into a final save percentage.
| Shots Against | Goals Against | Saves | Save Percentage |
|---|---|---|---|
| 25 | 2 | 23 | .920 |
| 35 | 2 | 33 | .943 |
| 45 | 3 | 42 | .933 |
| 50 | 1 | 49 | .980 |
As you can see, the workload (shots against) plays a huge role in contextualizing a goalie's final stat line for the night.
Historical Trends in Save Percentage
It’s also crucial to remember that what's considered a "good" save percentage has changed over time. The league average has been creeping up for decades, as shown in the chart below.
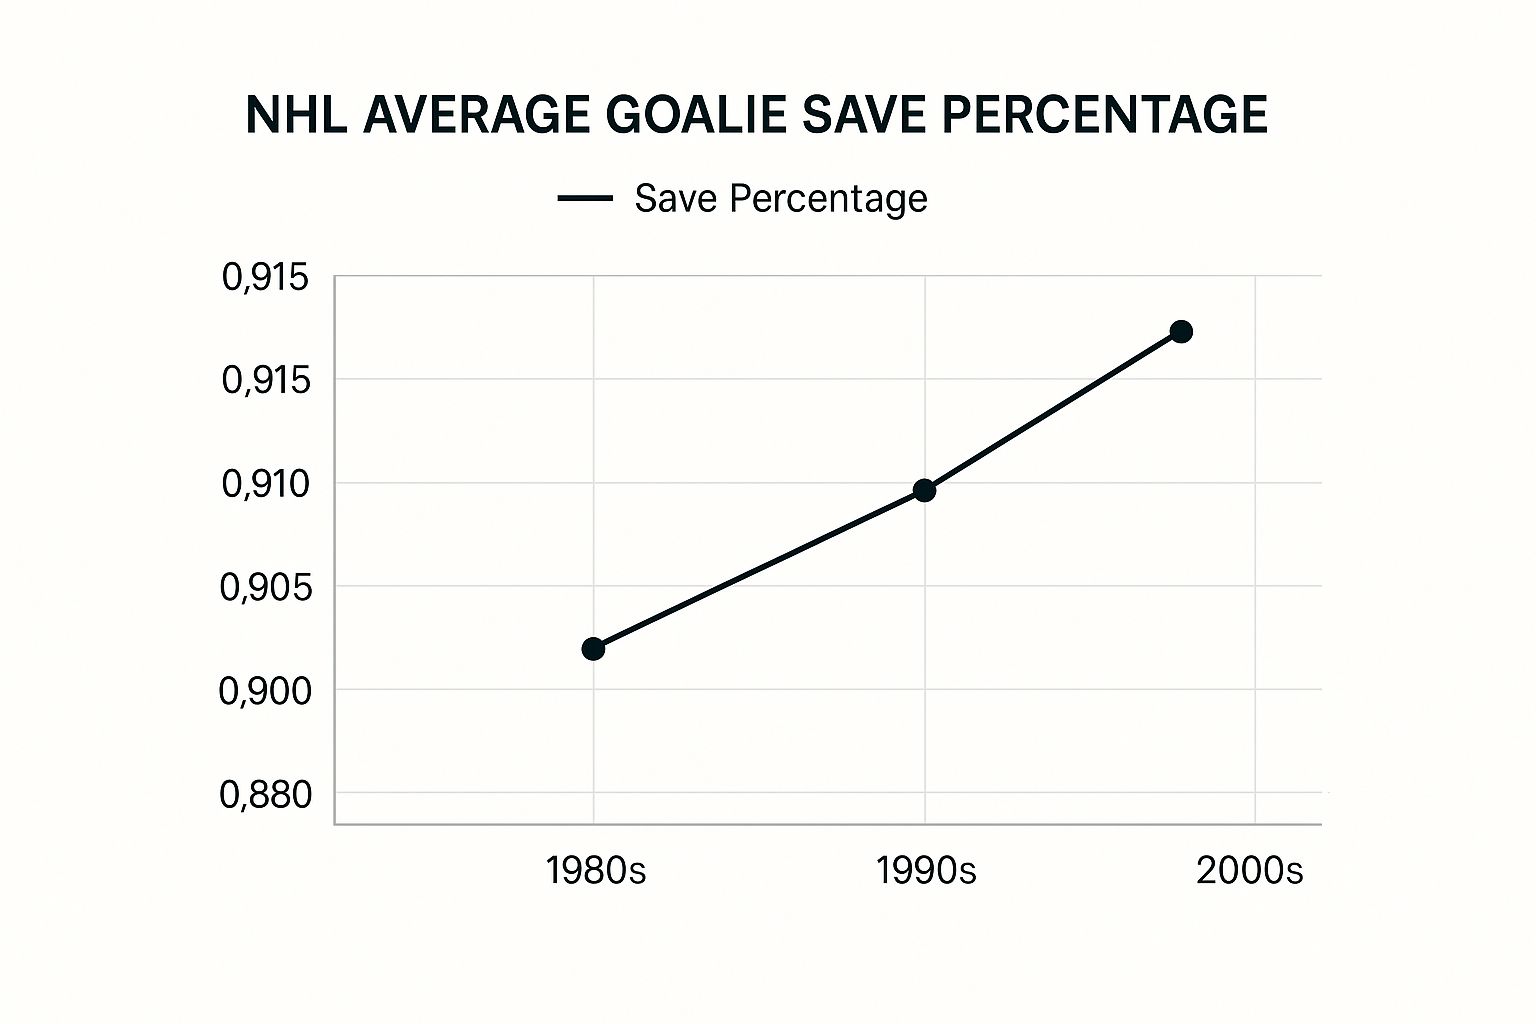
This steady climb is a direct result of massive improvements in goaltending technique, specialized coaching, and better equipment since the 1980s. This historical context is vital when comparing goalies from different eras. A .900 SV% might have been elite in the 1990s, but today, that's considered below average.
What Makes a Good Save Percentage in the NHL
So, you know how to calculate a goalie's save percentage. Great. But what do the numbers actually mean? A goalie’s SV% isn't just a number on a screen; it’s a story about their season, their career, and where they stack up against the best in the world.
Think of it like a batting average in baseball. Everyone knows a .300 hitter is elite, and a .220 hitter is struggling. Hockey has its own benchmarks. A .915 SV% puts a goalie in the conversation for the Vezina Trophy, while a netminder stuck around .898 SV% is probably riding the pine or having a really, really tough year.
These aren't random numbers—they're shaped by the league's scoring environment. Getting a feel for these tiers is the first real step to analyzing a goalie’s performance with genuine insight.
Defining the Tiers of Performance
In today’s NHL, we can break down a goalie's full-season save percentage into a few simple performance levels. It's a quick way to gauge exactly where a netminder stands.
Elite (.920+ SV%): This is the gold standard. A goalie posting these numbers is a game-changer, capable of stealing wins and dragging a team deep into the playoffs. It’s incredibly rare to sustain this over a full 82-game season.
Great (.910 - .919 SV%): This is the mark of a top-tier starting goalie. They’re reliable, consistent, and give their team a legitimate chance to win every single night. Most Vezina candidates live in this range.
League Average (.900 - .909 SV%): Goalies here are capable NHL starters, but you’ll probably see some inconsistency. They get the job done but aren’t usually winning games all by themselves.
Below Average (Below .900 SV%): Oof. Consistently falling below this line is a major red flag. This is the territory of struggling starters and backups, and it can sink a team’s playoff hopes fast.
You can think of these tiers like school grades. A .920 is an A+, a .910 is a solid A, and anything below .900 is heading toward a failing grade for a starting NHL goalie.
The Ever-Changing Context of Save Percentage
Here’s where things get interesting: a goalie’s stats don't exist in a vacuum. The league’s scoring environment plays a huge role in what makes a "good" SV%, and it has changed dramatically over the years. You simply can't compare a goalie from the high-flying 1980s to one from the defensive "dead puck" era of the early 2000s without that context.
NHL save percentages have swung wildly through the decades, pushed and pulled by rule changes, coaching strategies, and new goaltending techniques. The 1993-94 season, for example, saw one of the lowest league-wide save percentages ever at .895—a reflection of wide-open, fire-wagon hockey.
Then, starting around 1997, the league average began to climb, crossing the .900 mark and eventually peaking near .915 by 2016. That shift signaled an era of better goaltending, tighter defensive systems, and yes, much bigger equipment. You can dig deeper into why NHL save percentages have been declining for a more detailed analysis.
This historical trend is vital. A goalie with a .905 SV% in 1995 was likely among the league's best, while a goalie with the same number today would be considered strictly average.
Understanding this context is the key to fairly judging legends from different eras. It gives you the power to look at a stat line and see not just what the number is, but what it truly meant at that specific moment in NHL history.
Learning From the All-Time Greats
Numbers tell stories. In the world of NHL goaltending, a consistently high save percentage tells the tale of a legend. More than any other stat, it’s the dividing line between the good and the truly great. When you look at the careers of the icons, you see what it really takes to maintain an elite NHL goalie save percentage year after year.
These guys didn't just have one or two hot seasons; they built legacies on being statistically dominant for a very long time. They set the benchmarks that today's goalies are still chasing, cementing their place in hockey history.
The Standard of Excellence Set by Hasek and Dryden
When you talk about the Mount Rushmore of goaltending stats, two names always come up: Dominik Hasek and Ken Dryden. They played in different eras with wildly different styles, but they were both unbelievably good at stopping the puck.
The ultimate measure of a goalie's sustained ability is their career save percentage. The highest career save percentage for goalies who debuted after the 1955-56 season belongs to Dominik Hasek, who posted an incredible .922 SV% over 735 games. Right there with him is the legendary Ken Dryden of the Montreal Canadiens, who also finished with a .922 SV%. To put that in perspective, a modern great like Tuukka Rask wrapped up his career with a .921 SV%, showing just how exclusive that club is.
Known as "The Dominator," Dominik Hasek completely redefined the position with his chaotic, acrobatic style. The fact that he maintained such a high save percentage while facing an absolute barrage of shots in Buffalo is a testament to his unique genius.
Dryden, on the other hand, was the picture of calm, positional goaltending. He played behind a powerhouse Canadiens team, but his remarkable numbers prove that even with a great defence in front of you, individual performance still has to be exceptional.
To get a clearer picture of where these titans stand, here's a look at some of the best career save percentages in the modern era.
All-Time Career Save Percentage Leaders (Post-1955)
A look at some of the goaltenders with the highest career save percentages in the modern NHL era.
| Goaltender | Team(s) | Career Save Percentage | Seasons Played |
|---|---|---|---|
| Dominik Hasek | CHI, BUF, DET, OTT | .922 | 1990-2008 |
| Ken Dryden | MTL | .922 | 1970-1979 |
| Tuukka Rask | BOS | .921 | 2007-2022 |
| Johnny Bower | NYR, TOR | .921 | 1953-1970 |
| Connor Hellebuyck | WPG | .916 | 2015-Present |
| Henrik Lundqvist | NYR | .918 | 2005-2020 |
| Roberto Luongo | NYI, FLA, VAN | .919 | 1999-2019 |
These numbers highlight the incredible consistency required to stay at the top of the league for an entire career.
What Made Them So Consistently Dominant?
It’s one thing to have a great season; it's another to build a Hall of Fame career on it. The goalies at the top of the all-time save percentage list share a few key traits.
- Remarkable Consistency: These goalies rarely had an "off" night. Their performance floor was exceptionally high, meaning even on their worst days, they were still better than most.
- Mental Toughness: The pressure of being the last line of defence is immense. Legends like Hasek and Dryden had an unshakeable mental game, allowing them to bounce back from a bad goal or a tough loss instantly.
- Technical Mastery: While their styles were worlds apart, they were all masters of their craft. Whether it was Dryden's precise angles or Hasek's uncanny reflexes, they had honed their skills to near perfection.
Long-term consistency is what separates the legends from the rest. Plenty of goalies put up impressive single-season numbers, but doing it for a decade or more is what makes you great. A player’s career arc, like the one you can see in the detailed statistics for Marc-Andre Fleury, shows just how hard it is to maintain those elite numbers season after season.
By studying these icons, we see that a high career save percentage isn't just a number—it’s the result of years of dedication, mental strength, and an unwavering commitment to being the best.
Going Beyond Basic Save Percentage
While the standard NHL goalie save percentage is a great starting point, it has one major blind spot. The basic formula treats every single shot like it’s the same. In a game as fast and chaotic as hockey, we all know that’s just not true.
Think about it. A goalie faces two completely different shots in a game. First, a routine wrist shot from the blue line with a clear view. Next, a one-timer from the slot on a 2-on-1 rush. Basic save percentage says stopping both of these is an equal accomplishment. Any fan knows the second one is a whole different beast.
This is where the next level of hockey analytics comes in. To get a real sense of a goalie's skill, we need to add a layer of context that accounts for shot quality.
Introducing Shot Quality
Shot quality is the missing piece of the puzzle. It’s a simple but powerful idea: a shot's location, type, and the situation it comes from all dramatically change how likely it is to become a goal. This concept completely transforms how we evaluate goaltending.
By analyzing where every shot comes from, modern analytics can assign an "expected goal" value to it. This lets us move past just counting saves and start measuring how a goalie performs against the actual difficulty of the chances they face.
Two key metrics have emerged from this way of thinking, giving us a much sharper picture of a goalie's true impact. These are the stats that separate the good from the truly elite.
High-Danger Save Percentage (HDSV%)
The first advanced stat to get a handle on is High-Danger Save Percentage (HDSV%). This metric cuts through the noise. It filters out all the easy, low-percentage shots from the perimeter and focuses only on saves made on high-danger scoring chances. These are the shots that goalies are supposed to struggle with.
What counts as a high-danger chance?
- Shots from the "slot": This is prime real estate, right in front of the net.
- Rebound chances: Those second and third whacks at the puck when a goalie is scrambling are incredibly dangerous.
- Odd-man rushes: Breakaways and 2-on-1s create the toughest situations for any netminder.
A goalie with a high HDSV% is the one who consistently bails their team out when defensive breakdowns happen. It’s the ultimate measure of a goalie’s ability to make the clutch, game-changing saves that win championships.
Goals Saved Above Expected (GSAx)
This might just be the most powerful advanced goalie stat we have today. Goals Saved Above Expected (GSAx) takes the shot quality concept to its logical conclusion. It looks at every single shot a goalie faces and calculates the probability of each one going in, based on historical data from thousands of similar shots.
Add up all those probabilities, and you get the "expected goals against." GSAx is simply the difference between what was expected and what the goalie actually allowed.
A positive GSAx means the goalie has saved more goals than an average netminder would have, given the quality of shots they faced. A negative GSAx means they've performed worse than expected.
For example, if a goalie was expected to allow 50 goals over a 20-game stretch but only let in 42, their GSAx would be +8. This means their performance single-handedly saved their team eight goals compared to what an average goalie would have done.
It’s a fantastic way to quantify a goalie's direct contribution, much like how Wins Above Replacement helps evaluate a skater's impact. To dive deeper into this concept, you can learn more about what Wins Above Replacement means in hockey and how it provides a complete performance picture.
By embracing these advanced metrics, you can elevate your analysis from just looking at numbers to truly understanding a goalie's skill.
Using Save Percentage to Win Your Fantasy League
Knowing the theory behind NHL goalie save percentage is one thing. Using it to dominate your fantasy league or make smarter bets? That’s where the real fun starts. This metric is your key to uncovering hidden value, spotting hot streaks, and getting a serious edge over your competition.
For fantasy hockey managers, save percentage is a goldmine. Wins are a flashy category, sure, but they’re often a team stat in disguise. A goalie on a powerhouse team might rack up Ws but torpedo your other categories if his individual numbers are just okay.
Instead, look for the hidden gems. A goalie with a high save percentage on a defensively shaky team is basically a fantasy hockey cheat code. He might not get you a ton of wins, but he’ll face a blizzard of shots. And a goalie stopping .915 of a 40-shot barrage is way more valuable than one stopping .905 of a 25-shot snooze-fest.
Finding Undervalued Goaltending Talent
Identifying these workhorse goalies means looking past the team standings. You're hunting for a netminder whose talent is better than his team's record—a core part of any winning approach. You can find more ideas in our guide to a successful fantasy hockey draft strategy.
Here’s what to look for:
- High Shot Volume: Target goalies on teams that bleed shots but have a goalie who keeps them in the game.
- Consistent SV%: Find a tender who consistently posts a solid save percentage (think .910 or better), even when his team struggles.
- Strong Advanced Stats: A goalie with a high High-Danger Save Percentage (HDSV%) or Goals Saved Above Expected (GSAx) is proving he can handle the tough stuff—a great sign of sustainable performance.
This strategy helps you build a goaltending duo that can pile up a massive number of saves, often making up for a lack of wins in points-based leagues.
Applying SV% to Sports Betting
For bettors, a goalie’s recent save percentage is a powerful signal. Goalies, like any athlete, get hot and cold. Tracking their SV% over the last five or ten games can tell you if a goalie is seeing the puck like a beach ball or if he’s fighting it.
A goalie riding a .940 SV% streak over his last few starts is completely in the zone. He’s a great bet to steal a game, even as an underdog. On the flip side, a goalie struggling with an .880 SV% over that same stretch is a major red flag—a good time to bet against him, especially if he’s facing a high-powered offence.
The nationality of a goaltender can also add some interesting long-term context. Historically, Canadian NHL goaltenders have consistently been among the league leaders. Icons like Ken Dryden, who holds a staggering career .922 SV% with the Canadiens, set that standard. You can dig into more stats on the top Canadian goalies at Statmuse.com.
Common Questions About Goalie Stats
Alright, let's clear up some of the questions that always pop up when we talk about goalie stats. Whether you're new to the game or have been watching for years, these are the details that separate a casual glance at the box score from a real understanding of who's truly playing well.
The big one is always the difference between Save Percentage (SV%) and Goals-Against Average (GAA). Here’s the simplest way to think about it: SV% tells you what the goalie controlled, while GAA tells you what the team gave up.
A goalie’s job is to stop the puck, and Save Percentage measures exactly that—how many saves they made out of all the shots they faced. GAA, on the other hand, is massively influenced by team defence. A great goalie on a defensively weak team that bleeds shots will almost always have a worse GAA than an average goalie on a structured, tight-checking team.
Think of it this way: a goalie who puts up a .925 SV% while facing 40+ shots a night is working miracles, even if their GAA is mediocre. That’s why analysts lean so heavily on SV%—it’s the purest measure of a goalie’s individual performance.
How Many Games Make a Stat Reliable?
This question comes up all the time. A goalie can get red-hot for a week and post a ridiculous .950 SV%, but that doesn’t mean they’re the next Hasek. So, when can you actually trust the numbers?
For the most part, here’s a good rule of thumb for sample size:
- Under 20 Games: Be skeptical. You're looking at a small window where luck and hot streaks play a huge role. It's too volatile to make any big calls.
- 20-40 Games: Now we're talking. This is a solid sample where real patterns start to show. The numbers are becoming a much more reliable indicator of a goalie's true talent.
- A Full Season (50+ Games): This is the gold standard. Over a full season, the highs and lows even out, giving you a very clear picture of who that goalie really is.
A small sample can still be handy for short-term stuff, like a fantasy hockey matchup or a betting line. But for judging a goalie’s long-term ability, more data is always king.
Do Stats Differ in Game Situations?
Absolutely. A goalie's overall NHL goalie save percentage is just an average of how they perform in totally different scenarios. You have to look at the splits to get the full story.
The most important split is 5-on-5 versus special teams. A goalie might be a rock at even strength but struggle mightily on the penalty kill, where they’re facing a firing squad of high-quality chances. Digging into these situations gives you way more insight. For example, a goalie with a high 5-on-5 SV% is the backbone of their team, keeping them in the game during the vast majority of play.
When you start looking at these details, you’re moving beyond the basic box score and analyzing goalies like a pro.
Ready to put this knowledge to work? PuckNStick has all the detailed analytics, leaderboards, and advanced stats you need to dive deeper. Explore comprehensive goalie stats for every player in the league today at https://www.pucknstick.com.