
What is Wins Above Replacement? Your Complete Guide
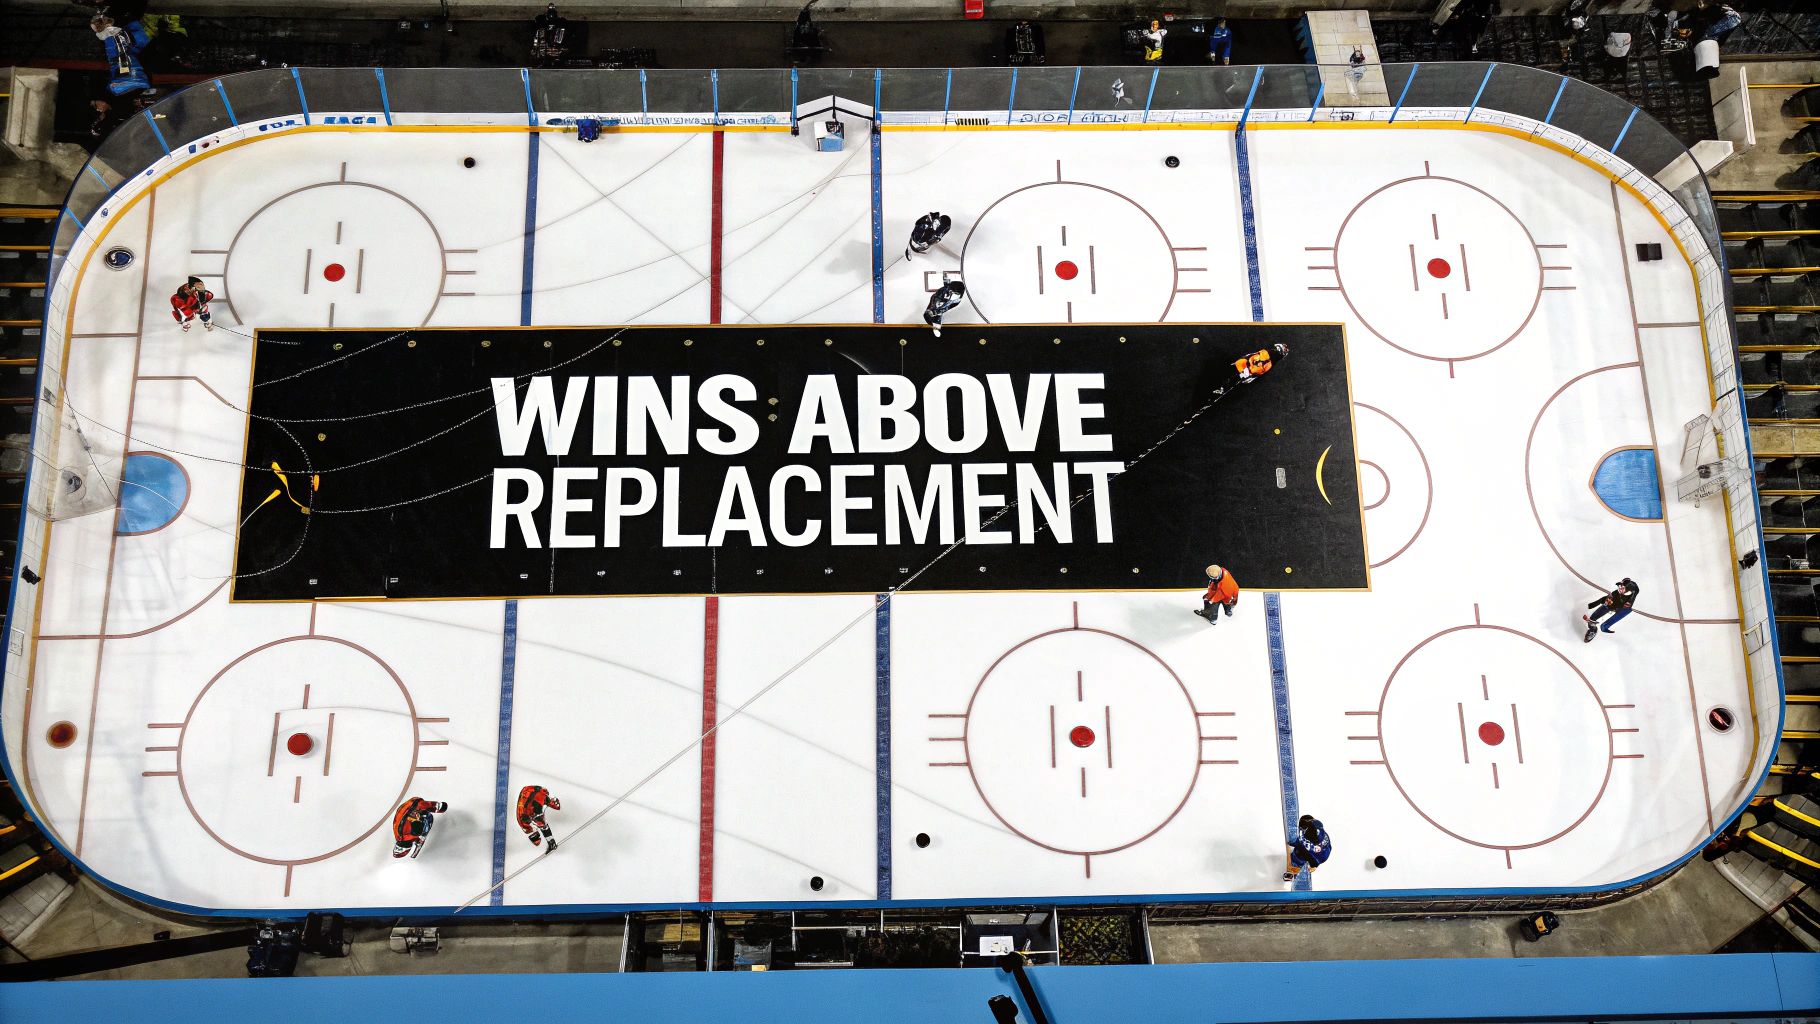
Wins Above Replacement, or WAR, is one of those all-in-one stats that tries to answer a simple question with a whole lot of complex math: what is a player’s total value to their team?
It boils everything down into a single number that estimates how many more wins a player gives their team compared to a generic, easily acquired "replacement-level" player.
Decoding Wins Above Replacement
Think about it from a GM’s perspective. How do you really compare the value of a 40-goal scorer to a shutdown defenceman who eats tough minutes but barely shows up on the scoresheet? Goals and assists only tell you so much. Plus-minus can be misleading.
This is exactly the problem WAR was built to solve. Instead of looking at stats in a vacuum, it pulls together multiple parts of a player’s game—offence, defence, special teams—into one number. This makes it way easier to have those apples-to-apples comparisons across different positions and player types.
The Core Concept: A Replacement-Level Player
The whole idea of WAR is built on the concept of a "replacement-level" player. This isn't a specific person, but more of a theoretical baseline.
Imagine a player who is:
- Always available, maybe sitting in the AHL or as an unsigned free agent.
- Cheap to acquire, usually earning the league minimum salary.
- Essentially a fringe, run-of-the-mill NHL talent.
By setting this floor, WAR can measure how much extra value a player provides. For instance, a player with a WAR of 3.0 is credited with adding three more wins to their team's season than a replacement player would have in that same spot.
In simple terms, WAR answers the question: "If this player got injured and we had to call up a generic minor leaguer to take their spot, how many wins would our team lose over the course of a season?"
To give you a quick handle on the key ideas, here’s a simple breakdown.
WAR At a Glance
| Concept | Simple Explanation |
|---|---|
| All-in-One Metric | Combines offence, defence, and special teams into a single value. |
| Replacement Level | The performance of a readily available, minimum-cost player (like an AHL call-up). |
| Value in Wins | Measures a player's contribution in the most important currency: team wins. |
| Cross-Position Use | Allows for more meaningful comparisons between forwards, defencemen, and even goalies. |
| Context is Key | The value of WAR goes beyond goals and assists, rewarding two-way play and defence. |
This table just scratches the surface, but it helps frame why this metric has become so popular.
Why a Single Number Matters
The real magic of WAR is its ability to synthesize a ton of information. It takes everything from shot creation and defensive impact to power-play contributions and translates it all into wins—the only thing that really matters in the standings.
This gives you a much fuller picture than just looking at possession stats like Corsi, which are powerful but only part of the story. You can learn more about those in our guide to what is Corsi in hockey.
As hockey analytics got smarter, the community needed a way to move past simply counting goals. WAR offers that deeper, more context-rich assessment of a player’s true impact, helping us appreciate the quiet contributions of a defensive forward just as much as the highlight-reel goals from a superstar.
How Hockey WAR Is Calculated
Calculating Wins Above Replacement can feel a bit like black magic, but the thinking behind it is actually pretty simple. The main goal is to break down everything a player does on the ice, assign a value to each action, and then add it all together. Every WAR model has its own unique flavour, but they all follow the same fundamental recipe: building a player's total value piece by piece.
At its core, the calculation isolates a player's impact in every possible game situation. It's not just about counting goals and assists; it's about quantifying how much a player drives play in key areas and then boiling all that down into a single, easy-to-understand number.
The Building Blocks of Player Value
Every WAR model starts by looking at a player's performance in separate phases of the game. Think of it like building a house—each part of the game is a different room, and you have to construct each one before you can see the finished product.
The main components that go into most public WAR models are:
- Even-Strength Offence: This captures a player's knack for driving shot attempts, creating scoring chances, and putting the puck in the net when both teams are at full strength.
- Even-Strength Defence: On the flip side, this measures how well a player shuts down opponents by suppressing their shots and scoring chances.
- Power Play Offence: A player's ability to create offence on the man advantage is measured separately, since the context is completely different from 5-on-5 play.
- Penalty Kill Defence: In the same way, a player’s effectiveness at preventing goals while their team is shorthanded is isolated and valued.
- Penalties Drawn and Taken: The model also factors in discipline, giving a nod to players who draw more penalties than they take.
This approach ensures that a defensively-minded forward who’s a beast on the penalty kill gets credit for their contributions, even if they aren't lighting up the scoreboard. It paints a much more complete picture than old-school stats ever could.
The whole idea of an all-in-one metric like this actually started in baseball. Analysts wanted a single number to combine a player's hitting, fielding, and baserunning. That's how Wins Above Replacement (WAR) was born, estimating how many more wins a player adds compared to a generic 'replacement-level' player. This concept completely changed how players were valued, and it's been adopted by teams across North America—from MLB franchises in California to front offices in the NHL—to help with contract talks and trades. You can read more about how baseball pioneered the WAR metric to see where it all began.
Defining the Replacement-Level Baseline
The entire calculation pivots on one crucial concept: the "replacement player." This isn't a real person, but a theoretical benchmark. It represents the performance of a fringe player—the kind of guy you could call up from the AHL or sign for the league minimum. They are, by definition, perfectly average depth players.
The replacement level is the floor from which all value is measured. A player with a WAR of 0.0 is performing at exactly this baseline, meaning they aren’t adding any wins beyond what a generic call-up could provide.
By setting this floor, WAR gives us a vital point of reference. It lets us measure not just how good a player is, but how much better they are than the most basic, easily findable alternative. That's the key that unlocks the "wins above replacement" part of the whole thing.
The infographic below shows how baseball's WAR model pulls together different performance areas into one final score, a process that hockey analytics closely follows.
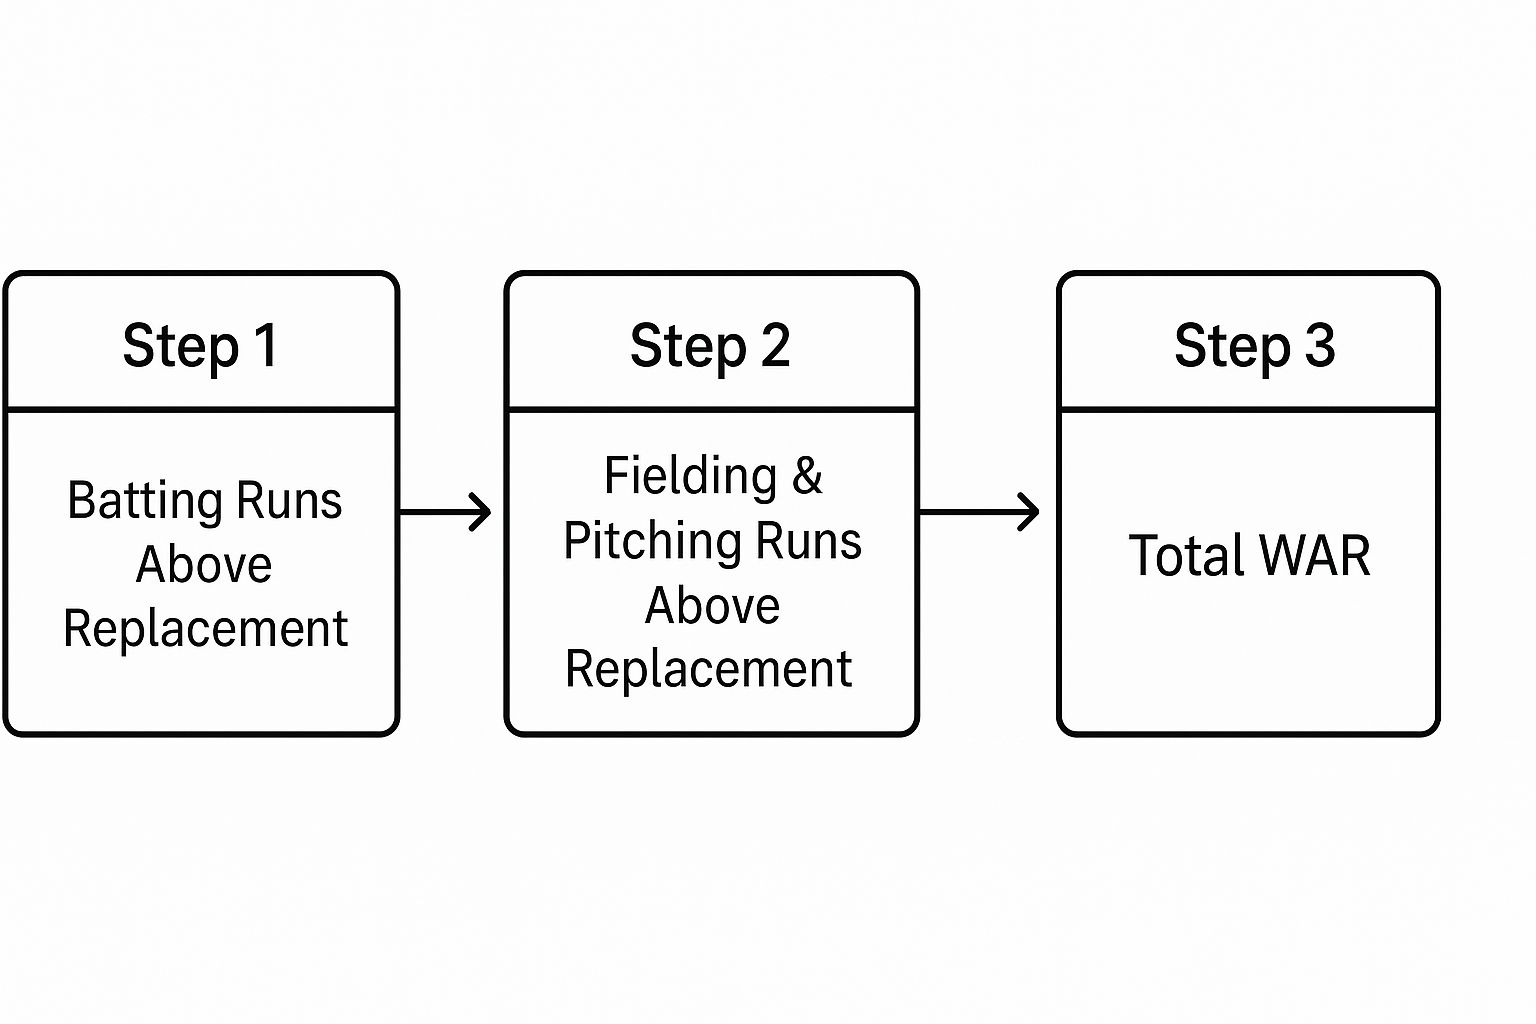
As you can see, distinct contributions like batting and fielding are measured on their own before being combined to create a single WAR value.
Adjustments and Final Conversion
Once a player's contributions in all these areas are tallied up, the model makes a few important adjustments. The biggest one is the positional adjustment. Let's be honest: playing centre is a tougher defensive job than playing on the wing, and playing defence is a whole different beast. WAR models account for this by giving a slight bump to players in more demanding positions.
After all the on-ice actions are measured and adjusted, the raw value (often calculated first as "goals above replacement") is converted into wins. This final step uses a league-specific conversion factor that estimates how many goals are worth one team win. The number that comes out the other side is the player's final WAR score—a single figure that sums up their total impact on the game.
Putting WAR Into Practice With Player Examples

Alright, the theory behind Wins Above Replacement is one thing. But seeing how it actually sizes up real players? That’s where it all clicks. A player’s final WAR score is a mashup of everything they do on the ice, and you quickly see how different types of players generate value in completely different ways.
By looking at a few common player archetypes, we can see how the metric rewards all-around dominance while also flagging players whose traditional stats might be a bit misleading. Let's break down how WAR assesses four distinct player types you see in the NHL every night.
The Elite Two-Way Superstar
This is your MVP candidate, the kind of player who’s just as dangerous in his own end as he is in the offensive zone. Think of guys like Aleksander Barkov or a prime Sidney Crosby—they don’t just create goals; they prevent them by shutting down the other team's best players.
Their WAR profile is strong everywhere you look:
- High Even-Strength Offence: They drive possession and constantly create scoring chances.
- High Even-Strength Defence: They smother opposing shots and opportunities.
- Positive Special Teams Impact: They’re leaned on for both the power play and the penalty kill.
A player like this could easily post a WAR of 4.0 or higher. That number tells you they are worth at least four full wins more than a replacement-level call-up over a season. Their value comes from having no real holes in their game.
The Pure Offensive Sniper
Next up, you have the high-flying winger who lives on the highlight reels but might not be the first guy you want back on defence. This player’s value is almost entirely wrapped up in their ability to score goals and quarterback a power play.
Their WAR components will look lopsided. They might have an elite score for even-strength offence and a massive power-play contribution, which pushes their value way up. But that’s only half the story. Their even-strength defence score could be hovering around zero or even dipping into the negatives, dragging their overall score back down to earth.
A player might score 35 goals but finish with a modest WAR of 1.5. This shows that while his scoring is obviously valuable, his defensive shortcomings cancel out a huge chunk of that offensive impact.
This is a perfect example of why WAR is so useful. It adds much-needed context to flashy point totals by asking what a player gives back at the other end, giving you a far more complete picture of their true impact.
The Shutdown Defenceman
This player is the polar opposite of the sniper. They rarely score, and you won’t see them on many highlight packages. Their job is to make the other team’s stars miserable, and their value is almost purely defensive.
A true shutdown defenceman might have a low even-strength offence score and contribute next to nothing on the power play. But their even-strength defence and penalty-killing numbers would be off-the-charts good. They win games by preventing goals, which is just as important as scoring them.
Because of this, a player with only 20 points on the season could still post a stellar WAR of 2.5. The metric properly rewards their immense defensive value—something traditional stats like goals and assists completely ignore.
The Dependable Third-Liner
Finally, let’s look at the reliable bottom-six forward. This player isn’t a star, but they’re a solid contributor who knows their role. They chip in with some secondary scoring, eat tough minutes, and are a key part of the penalty kill.
Their WAR profile will be solid across the board, but not spectacular in any one area. They don't have an elite skill that stands out, but more importantly, they don't have any glaring weaknesses that hurt the team. Their final score might land somewhere around a WAR of 0.8.
This tells you they are a genuine NHL-calibre player who helps the team win more than an AHL call-up would. These are the crucial depth guys that good teams are built on. Understanding their subtle but real value is key in modern hockey, especially for fantasy. To see how these hidden contributions impact a player's worth in a trade, a good https://www.pucknstick.com/blog/fantasy-hockey-trade-analyzer can help you quantify it.
What Is a Good WAR Score in Hockey?
Understanding the formula behind Wins Above Replacement is one thing, but knowing what the numbers actually mean is where it gets useful. A player’s final WAR score isn't just some abstract figure; it tells a story about their real-world impact and neatly sorts them into tiers of value.
The key is learning to translate these numbers into the player roles we all recognize—from an MVP contender to a fourth-line grinder. Once you can do that, you can confidently size up a player’s performance.
Interpreting the WAR Scale
Think of WAR as a quick shorthand for a player's calibre. While different public models might spit out slightly different numbers, they all follow the same general logic. A score of 0.0 is your baseline—a "replacement-level" player.
Anything positive means the player is adding value. A negative number? That suggests the team might be better off with a generic call-up from the AHL.
Here’s a general guide to what a single-season WAR value tells you:
- Below 0.0 (Replacement Level): These players are struggling to keep up at the NHL level. Their spot in the lineup is likely costing the team more than a readily available alternative would.
- 0.0 to 1.0 (Depth/Fringe Player): This is home to most third and fourth-liners and bottom-pairing defencemen. They're legit NHLers who fill a role, but they aren't the ones driving the bus.
- 1.0 to 2.0 (Solid Starter): Now we're talking about the core of a roster. These are your dependable, everyday second-line forwards and top-four defencemen who consistently pull their weight.
This basic breakdown helps set the stage, but the real difference-makers live in the higher tiers.
It's easy to think any positive WAR is good. And while that's technically true, a player who consistently hovers below 0.5 isn't adding much value and is probably a replaceable part on any serious contender.
Elite Tiers of Performance
As we climb the WAR ladder, we get into the territory of All-Stars and franchise players. These are the guys who can single-handedly tilt the outcome of games and even entire seasons.
- 2.0 to 3.0 (All-Star Calibre): A player in this range is a clear top-tier talent. They're usually among the best at their position and are foundational pieces for a winning club.
- 3.0+ (MVP Candidate): Getting to a WAR of 3.0 is incredibly rare and is reserved for the league’s absolute superstars. These players dominate across the board and are the ones you see in conversations for major awards.
The concept of using WAR to define a player’s value started in baseball, where it’s used to separate a star’s contributions from what easily replaceable talent could provide. For instance, in 2023, the Los Angeles Dodgers' Mookie Betts posted a WAR around 7.5, showing how his all-around game was essential to their division title. Likewise, San Francisco Giants pitcher Logan Webb had a WAR of about 4.0, highlighting his massive impact on their playoff run. You can see how WAR is used to evaluate MLB players on their official site.
To make it even clearer, here’s a table that breaks down the different WAR value ranges and the type of player they typically represent.
Player Caliber by WAR Value
This table provides a general framework for understanding what a player's single-season WAR value means in terms of their on-ice impact.
| WAR Value Range | Player Caliber and Role |
|---|---|
| Below 0.0 | Replacement Level / Sub-NHL Caliber |
| 0.0 to 1.0 | Depth Player / Third or Fourth Liner / Bottom-Pair D |
| 1.0 to 2.0 | Solid Starter / Second Liner / Top-Four Defenceman |
| 2.0 to 3.0 | All-Star Calibre / Top Line Forward / Top-Pair Defenceman |
| 3.0+ | MVP Candidate / Elite Superstar |
With this framework, you can look at any player’s WAR and get an immediate, clear picture of the value they're bringing to their team. It turns a complex analytical score into a simple, powerful evaluation tool.
How Teams Use WAR for Roster Building

Wins Above Replacement isn't just a cool metric for fans to debate online; it's a legitimate tool that has changed how NHL front offices assemble their teams. General managers are always hunting for a competitive edge, and WAR gives them a data-driven way to uncover value that old-school stats just can't see.
This metric forces the conversation to move past simple goals and assists. It provides a more complete picture of a player's total impact, giving teams a sharper idea of what they're truly worth.
Finding Hidden Gems in the Market
One of the best uses of WAR is sniffing out undervalued players in free agency or on the trade block. A guy might have pretty modest point totals, but if he's a beast on the penalty kill and shuts down the other team's top line, his WAR score can be surprisingly high.
These are the exact players that analytics-forward teams love to target.
By zeroing in on players with strong underlying WAR numbers, a front office can add real talent without paying the superstar premium that comes with gaudy offensive stats. It’s how smart organizations build deep, effective rosters that punch above their weight class.
Sharpening Contract Negotiations
WAR has also become a massive piece of the puzzle in contract talks and salary arbitration. When an agent comes to the table pointing at a player's goal totals to justify a huge payday, the team can fire back with WAR data showing how defensive liabilities are dragging down their overall value.
This creates an objective, numbers-based foundation for figuring out a player's salary. It helps make sure contracts line up with a player's actual on-ice impact, preventing teams from overpaying for one-dimensional players. That’s crucial for managing the books, a process you can follow with an up-to-date NHL salary cap tracker.
The whole idea of using WAR to pin down a player's value really took off in baseball, where it has reshaped player assessment for decades. For example, a legendary player like Barry Bonds, who spent most of his career with the San Francisco Giants, racked up an incredible career WAR of around 162. It cemented his place as one of the most valuable players ever.
WAR gives you that unified metric to make those kinds of historical comparisons, a practice now becoming standard in hockey.
Diagnosing Team Strengths and Weaknesses
Beyond just looking at individual players, adding up the WAR scores across an entire roster gives a GM a powerful diagnostic tool. You can see, at a glance, where the team's real value is coming from.
- Is our success all from our star forwards while the defence is holding us back? Summing up the WAR for each position group will make the answer obvious.
- Is our team depth a real strength or just an illusion? The WAR numbers from your bottom-six forwards and third-pairing defencemen will tell you if they are actually helping you win games.
By tallying up the WAR of every player, a team gets a pretty good estimate of its "true" talent level. If a team's actual win total is way higher than its collective WAR suggests, they might be getting lucky and are due for a regression.
This big-picture view helps teams make smarter, more strategic moves. Whether it's pinpointing a specific need at the trade deadline or mapping out a long-term rebuild, understanding WAR gives NHL front offices a much clearer path to building a real contender.
Where WAR Gets a Little Fuzzy
Wins Above Replacement is an awesome tool for sizing up a player's impact, but it’s not a magic eight-ball. To use it right, you have to know its limits and avoid some common trip-ups. No single number can ever perfectly capture the beautiful chaos of a hockey game, and WAR is no different.
The biggest thing to remember is that WAR is a highly informed estimate, not gospel. The models behind it are complex, built on layers of data and assumptions. They do a fantastic job of summarizing a player's total value, but they aren't flawless.
An Estimate, Not a Final Verdict
Treating WAR as a definitive ranking is the fastest way to get it wrong. The models are always evolving as analysts get their hands on better data and cook up smarter ways to measure what happens on the ice. Today's cutting-edge formula might be old news in a few years.
This brings us to a key point when comparing players. Agonizing over whether a player with a 2.1 WAR is truly better than one with a 2.3 WAR kind of misses the forest for the trees.
The tiny gaps between similar WAR scores are often just statistical noise. Instead of getting hung up on decimal points, it’s much smarter to use WAR to group players into general tiers: "elite," "solid starter," or "depth guy."
Those small differences are a reminder that WAR should be the start of a conversation, not the end of it. It tells you what a player's value is, but you need other stats to understand the why.
The "Black Box" Problem
One of the most common knocks on WAR is that it can feel like a "black box." The formulas are so intricate—mixing shot metrics, positional tweaks, and quality of competition—that it’s not always clear how the final number gets spit out. That complexity can make some fans (and even some analysts) a bit hesitant to trust it.
It's a fair criticism. But that complexity is exactly what's needed to build a single, all-in-one metric. The goal isn’t to be confusing on purpose; it’s to account for as many variables as possible to paint the fullest picture of a player's contributions.
Factors Outside a Player's Control
A player’s WAR isn’t created in a vacuum. A bunch of external factors can push their score up or down, and the model can't always perfectly filter them out.
- Goaltending: Playing in front of a Vezina-calibre goalie can make a defenceman’s defensive stats look a little shinier than they really are. The opposite is also true.
- Coaching Systems: The system a player is in matters. An aggressive, all-out forecheck might pump up a forward's offensive numbers but hurt their defensive metrics.
- Team Strength: It's usually easier to put up good numbers on a powerhouse team than on a rebuilder. WAR models try to adjust for this, but it’s not a perfect science.
At the end of the day, understanding what is wins above replacement means accepting its imperfections. It’s an incredibly sharp tool for scouting talent, but it works best when you pair it with other stats and the good old-fashioned eye test. It adds a rich new layer to our understanding of who really drives winning hockey.
Your Top WAR Questions, Answered
Even after getting the hang of Wins Above Replacement, a few questions always seem to come up. Let's tackle the most common ones to really solidify your understanding of this game-changing metric.
Is WAR the Only Advanced Stat I Need?
Not a chance. While WAR is a fantastic all-in-one number, its real power comes alive when you use it as a starting point, not the final word on a player.
Think of it like the cover of a book—it gives you a great snapshot of the story. But stats like Corsi (shot attempts) and xG (expected goals) are the chapters inside that give you the details and the why. A high WAR tells you a player is making a big impact; those other stats show you how they’re doing it.
Why Do Different Websites Have Different WAR Numbers for the Same Player?
This is a great question, and it's super important to understand. Public models from places like Evolving-Hockey or TopDownHockey all use slightly different recipes to cook up their final WAR values.
One model might put a bit more emphasis on shot quality, while another could give more weight to a player’s penalty differential. These small tweaks in their formulas lead to slightly different final numbers.
The key is to be consistent. When you're comparing a few players, stick to one source. That way, you know you're making an apples-to-apples comparison. They're all trying to measure the same thing—total player impact—just from slightly different angles.
While the exact numbers might differ, a player who is considered elite in one public WAR model will almost certainly be ranked as elite in another. The general consensus is usually very strong, even if the decimal points vary.
Can I Use WAR to Compare Players From Different Eras?
This is where things get a little tricky. WAR models do adjust for the scoring environment of a given season, but trying to compare players across different decades should be done with a grain of salt.
The game has changed a ton over the years. We're talking about huge shifts in:
- Pace of Play: Today's game is worlds faster than it was in the 1980s.
- Strategy: The systems and on-ice tactics coaches use have completely evolved.
- Equipment: Modern sticks, skates, and pads have fundamentally changed how players shoot and move.
So, while WAR is incredible for sizing up players in the league today, using it to definitively say a star from 1985 was better than a modern superstar is a stretch. It’s useful for historical context, but it can’t capture all the nuances of past eras.
Ready to see how today's top players stack up? At PuckNStick, we provide the detailed stats and analytics you need to see the game like never before. Explore our comprehensive player leaderboards and analysis at https://www.pucknstick.com.