
What Is Corsi in Hockey? Understand the Key Analytics
So, what exactly is Corsi in hockey?
Let's cut through the noise. Think of it as a simple way to measure which team is controlling the puck. Instead of just counting goals, Corsi tracks every single shot attempt a team takes during even-strength play. That includes shots that hit the net, shots that miss the net entirely, and even shots that get blocked before they ever reach the goalie.
The Foundation of Puck Possession Analytics
This simple count of all shot attempts acts as a fantastic proxy for puck possession. The logic is straightforward: the team generating more shot attempts is the team spending more time in the offensive zone. They’re the ones dictating the flow of the game, putting pressure on the defence, and creating more chances to score.
While traditional stats like goals and assists tell you what did happen, Corsi gives you a much better sense of what could have happened—and what's likely to happen next. It moves beyond just the final score to measure the underlying process of a game.
The Origin Story of Corsi
The stat gets its name from Jim Corsi, a former goaltending coach with the Buffalo Sabres. He started tracking all shot attempts—not just the ones that forced a save—to get a clearer picture of how much pressure his goalies were really under. It was a groundbreaking idea that helped shift the focus from simple outcomes to the process that drives them. You can find more on the history of Corsi and its place in modern hockey analytics.
Why does it work so well? Because goals are rare events in hockey, but shot attempts happen all the time. This gives Corsi a much larger and more reliable sample size to tell us who's truly dominating the play.
Corsi isn't just a number; it's a narrative. It tells the story of territorial dominance, revealing which team is consistently driving play toward the opponent's net, even if the puck isn't going in.
Breaking Down the Components
At its core, Corsi is built by tallying three simple events that happen while a player is on the ice at even strength:
- Shots on Goal: Any shot that requires a save from the goalie or goes in the net.
- Missed Shots: Attempts that miss the net completely.
- Blocked Shots: Attempts that are stopped by a defending player before reaching the net.
Analysts add all these up to calculate a team's or player's Corsi For (CF) and Corsi Against (CA). This allows us to find their Corsi For Percentage (CF%), which is the single most important number.
If a team’s CF% is above 50%, it means they are generating more shot attempts than they are giving up. In other words, they’re controlling the puck more often than their opponent—a powerful indicator of long-term success.
To make it even clearer, here’s a quick breakdown of what goes into the Corsi calculation.
Corsi at a Glance Key Components
This table shows the fundamental pieces of the Corsi statistic, making it easy to see what each part measures and what it tells us about the game.
| Metric | What It Measures | What It Tells You |
|---|---|---|
| Corsi For (CF) | All shot attempts by your team (on goal, missed, blocked). | How much offensive pressure your team is generating. |
| Corsi Against (CA) | All shot attempts by the opponent (on goal, missed, blocked). | How much defensive pressure your team is facing. |
| Corsi For % (CF%) | The percentage of all shot attempts that belong to your team. | If your team is controlling over 50% of the play. |
Ultimately, these components combine to paint a picture of territorial dominance that goes far beyond what you see on the scoreboard.
Calculating and Understanding Corsi Numbers
So, how do we actually get to these numbers? Don't worry, you don't need a math degree. The formulas are surprisingly simple. At its heart, Corsi is just a comparison of shot attempts for your team versus shot attempts against. This straightforward tally tells you which team is driving the play and creating more offence at even strength.
To get started, we just need to track two things: Corsi For (CF), which is all the shot attempts your team takes, and Corsi Against (CA), which is every shot attempt the other team takes. From there, we can calculate the big one: Corsi For Percentage (CF%), the stat that really tells the story of puck possession.
The Core Formulas
Let's break down the basic math. It’s a lot less intimidating than it sounds.
- Corsi For (CF): Shots on Goal For + Missed Shots For + Blocked Shots For
- Corsi Against (CA): Shots on Goal Against + Missed Shots Against + Blocked Shots Against
- Corsi For % (CF%): CF / (CF + CA) * 100
It’s that simple. If a team’s CF% is over 50%, it means they generated more shot attempts than they gave up—a clear sign of positive puck possession. If it’s below 50%, it suggests they were on their heels, spending more time defending than attacking.
This image neatly visualizes how all those shot attempts get bundled together to produce a team's Corsi.
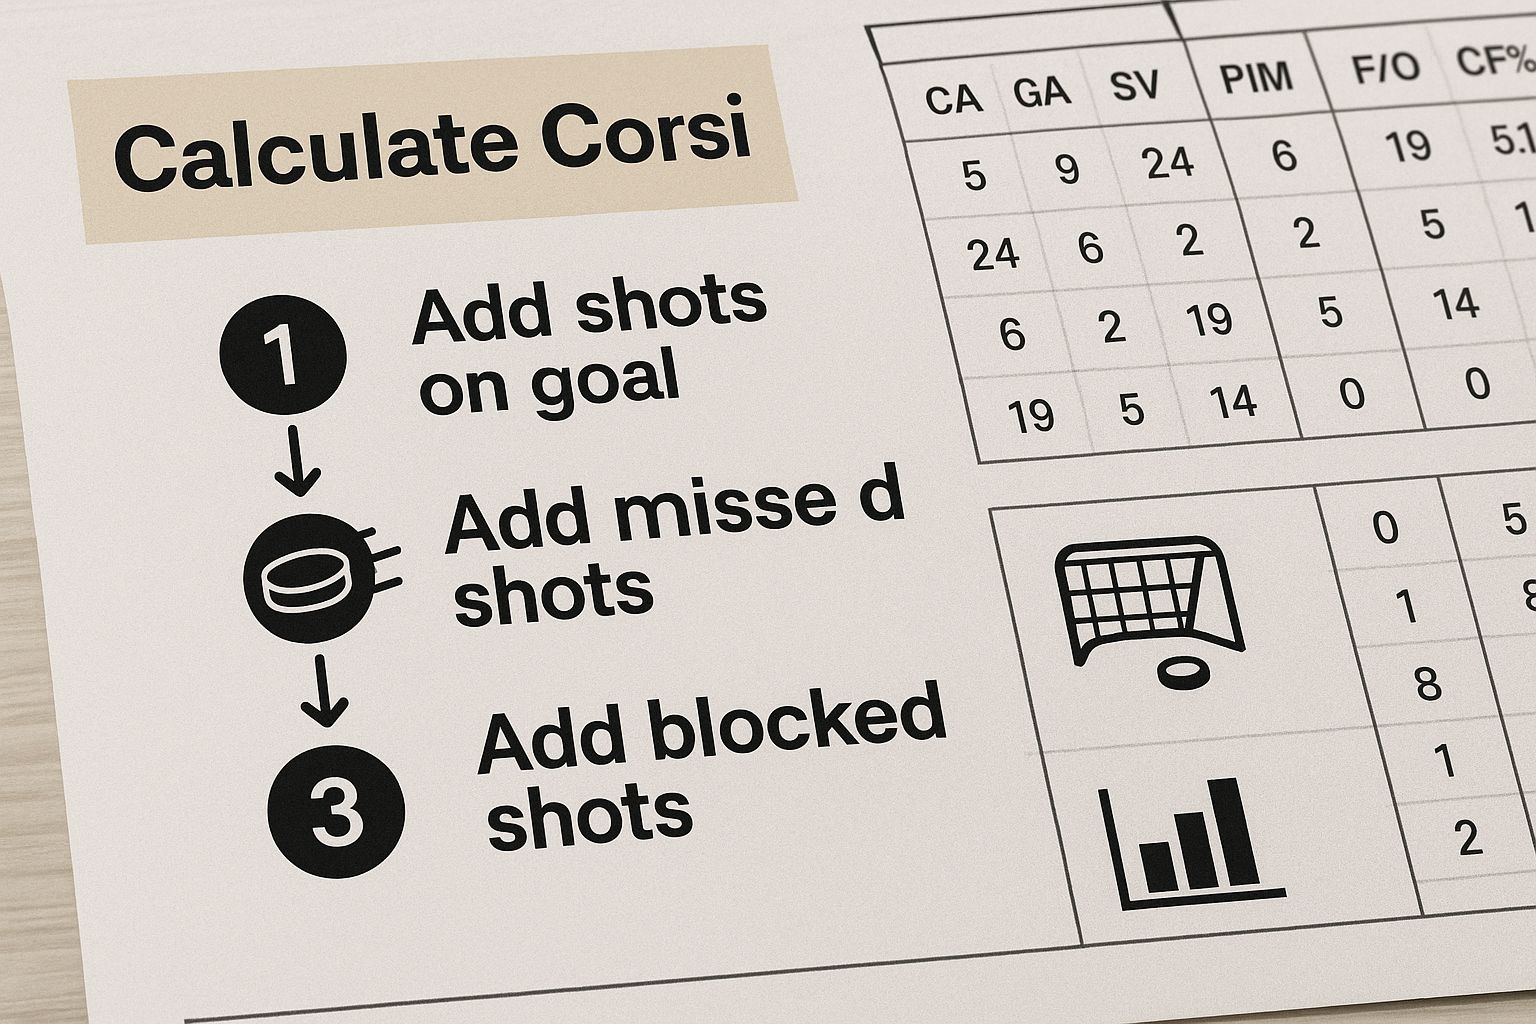
As you can see, the key is counting everything—shots that hit the net, miss the net, or get blocked—for both teams. That total pool of attempts gives us the final percentage.
Putting It into Practice
Let's use a real-world example. Imagine the Edmonton Oilers are facing off against the Calgary Flames. In a single period at even strength, the play breaks down like this:
- The Oilers get 12 shots on goal, miss another 5, and have 3 of their attempts blocked. Their Corsi For (CF) is 20.
- The Flames manage 8 shots on goal, miss 4 times, and have 4 shots blocked. This means the Oilers' Corsi Against (CA) is 16.
To figure out the Oilers' CF%, we plug those numbers into the formula: 20 / (20 + 16) * 100. The result is a CF% of 55.6%. That number tells us, without a doubt, that the Oilers tilted the ice in their favour during that period.
Isolating a Player's Impact with Corsi Relative
While CF% is a fantastic team metric, what about individual players? That’s where Corsi Relative (CorsiRel) comes in. This stat zeroes in on a single player's contribution by comparing the team's CF% when they are on the ice versus when they are off the ice.
A positive CorsiRel means the team is better at controlling shot attempts with that player on the ice. A negative number suggests the team actually does better without them. It’s a powerful way to identify the players who truly drive possession, even if they aren't lighting up the scoreboard.
Why Corsi Is a Powerful Predictor of Team Success

So, why do hockey analysts and front offices put so much stock in Corsi? It all comes down to sample size and probability. While goals are what ultimately win games, they're surprisingly rare events. A single game might only feature a handful of goals, and their timing can be wildly influenced by things like a hot goaltender, a lucky bounce off a skate, or one blown defensive assignment.
This makes goals a "noisy" statistic in the short term. A team can get completely outplayed for 60 minutes but steal a win because their goalie stood on their head or they buried one fortunate deflection.
Corsi cuts through that noise. By tracking all shot attempts—not just goals or shots on net—it gives us a much larger and more stable picture of a team's performance. It strips away the randomness of a hot goalie or a lucky bounce and gets right to the heart of a team's process: their ability to control the puck, generate offence, and pin the other team in their own end.
Moving Beyond Luck to Measure Process
Think of it like this: a basketball team that gets 100 high-quality shots is demonstrating a better process than a team that only manages 50. Even if that first team has an off night and can't buy a basket, their ability to create chances is more sustainable and far more likely to lead to wins over a full season. Corsi applies that exact same logic to hockey.
A team with a strong Corsi rating is consistently tilting the ice in their favour. This territorial dominance doesn't just lead to more scoring chances; it also wears down the opposition, draws more penalties, and simply gives the other team fewer opportunities to score themselves.
Corsi is powerful because it measures the process of winning, not just the outcome. It rewards the teams that consistently control the play, knowing that over an 82-game season, puck possession is one of the most reliable drivers of success.
This predictive power isn't just a theory; it's been proven time and again. Statistically, Corsi percentages have a strong link to winning percentages. For example, studies on Canadian NHL franchises like the Montreal Canadiens and Toronto Maple Leafs between 2014 and 2022 showed that a Corsi For % (CF%) above 51% consistently correlated with winning 60%-65% of their games. The metric works because its huge sample size of shot attempts smooths out the randomness that plagues goal-based stats.
The Long-Term Advantage
Ultimately, teams that consistently post high Corsi numbers are the ones that tend to make the playoffs and contend for championships. A high CF% is a sign that a team isn't just relying on luck to win games; they're building a foundation of puck control that leads to repeatable, sustainable success.
It gives us a much clearer picture of who the truly dominant teams are, which is crucial for identifying the league's top contenders. You can see how these metrics influence player performance by checking out our guide on the NHL stats leaders for 2025-26.
Putting Corsi into Action with Real Examples
Theory is one thing, but seeing Corsi applied to real players and teams is where its value truly clicks. The metric shines when it uncovers the hidden value that traditional stats like goals and assists might miss. It helps us understand the engine driving a team’s performance, not just the final score on the jumbotron.
Let’s look at a common scenario. Imagine a stay-at-home defenceman who doesn't put up a lot of points. His box score looks pretty unimpressive, and fans might start questioning his contribution.
But a quick look at his Corsi can tell a completely different story. If his Corsi For percentage (CF%) is consistently high—say, 56%—it means that when he’s on the ice, his team controls the puck and is firing way more shots toward the net than they’re giving up.
This player is a possession-driving powerhouse. He might not be scoring, but his defensive work and ability to get the puck moving up the ice are tilting the rink in his team's favour. This is the kind of quiet but massive impact that Corsi is brilliant at revealing.
Team-Level Analysis: A Case Study
Corsi is just as powerful for sizing up a whole team. Let's say a team goes on a five-game winning streak. Are they winning because they're dominating play, or are they just getting lucky bounces and lights-out goaltending? Corsi helps us separate sustainable success from a hot streak.
If a winning team has a CF% below 50%, that’s a major red flag. It tells you they’re being consistently outshot and out-possessed. While they might be winning now, their process is flawed, and they're probably due for a slump unless they start controlling the puck better.
A closer look at Corsi data for Canadian NHL teams is pretty revealing. For instance, the Calgary Flames consistently stayed above a 50% Corsi For percentage during the regular seasons when they made the playoffs between 2015 and 2023. It highlights a clear link between possession and success. You can see more about how possession metrics drive effectiveness in Canadian teams.
On the flip side, a team with a stellar 54% CF% that just lost a few tight games is a team to watch. Their underlying numbers suggest they're controlling the flow of play and are likely to start winning more consistently. This kind of analysis is vital for making accurate assessments, which is why Corsi is a key component in our own NHL player and team projections. By looking past the scoreboard, you get a much clearer picture of who is truly playing winning hockey.
Understanding the Limits of Corsi
While Corsi is a fantastic starting point for measuring puck possession, no single stat can ever tell the whole story. To really understand what's happening on the ice, you have to know a stat's blind spots. And Corsi definitely has a few.
The biggest knock against Corsi is that it treats all shot attempts equally. In its world, a panicked slapshot from the blue line through a wall of players counts just the same as a clean wrist shot from the high slot. It’s all about quantity, not quality.
Context is Everything
Game situations can also completely warp the numbers. Think about a team nursing a one-goal lead late in the third period. They'll often collapse into a defensive shell, letting the other team fire away from the outside.
This strategy can absolutely tank the leading team's Corsi percentage, making it look like they’re getting caved in. In reality, they’re just executing their game plan to perfection. It’s a classic case where the raw stats don't match what your eyes are telling you.
Corsi is a foundational piece of the analytical puzzle, not the final answer. It tells you who has the puck, but not necessarily what they are doing with it, making it the starting point for deeper analysis.
Beyond Corsi: Shot Quality Metrics
Because Corsi doesn't care about the quality of a scoring chance, analysts have come up with smarter metrics that build on its foundation by adding that crucial layer of context.
Expected Goals (xG): This is the modern go-to. It assigns a value to every single shot attempt based on historical data, looking at things like shot location, type, and angle. A tap-in attempt from the crease might have a 30% chance of going in (an xG of 0.30), while a shot from the point might only have a 2% chance (an xG of 0.02).
Scoring Chances (SC): This is a simpler approach. It just filters Corsi events to only include shots taken from a specific "home plate" area in front of the net—where most goals are actually scored.
High-Danger Chances (HDC): This drills down even further, isolating only the very best opportunities from the inner slot and right around the crease.
These advanced stats help us move from asking "Who is shooting?" to "Who is creating the best chances to score?" By layering in data on shot quality and location, we get a much clearer, more accurate picture of how teams and players are truly performing.
Commonly Asked Questions About Corsi
As you start digging into hockey analytics, a few questions about Corsi always seem to pop up. Let's tackle them head-on to clear up any confusion and solidify your understanding of this essential puck possession metric.
Is a High Corsi Always a Good Thing?
Most of the time, yes. A high Corsi For percentage (CF%) is one of the best signs that a team or player is controlling the puck and dictating the pace of the game. It’s a powerful predictor of future success because it points to a repeatable process: creating more shot attempts than you allow.
But context is everything. A defensive specialist who starts every shift in their own end might have a lower Corsi, even if they're executing their role perfectly. It’s a crucial piece of the puzzle, but never the whole picture. Always use it alongside other stats.
What Is the Difference Between Corsi and Fenwick?
The difference is simple: blocked shots.
- Corsi includes all shot attempts: shots on goal, missed shots, and blocked shots.
- Fenwick filters out blocked shots, counting only shots on goal and missed shots.
So, why the two metrics? Some analysts lean on Fenwick because they feel it’s a slightly better indicator of a player's ability to get the puck through traffic, making it a stronger predictor of future goals. Corsi, on the other hand, is generally seen as the best measure of raw territorial dominance and offensive zone pressure.
Think of Fenwick as a filtered version of Corsi. While Corsi captures total offensive pressure, Fenwick hones in on the attempts that actually make it past that first line of defence and have a real chance of becoming a scoring opportunity.
Where Can I Find Corsi Stats for My Favourite Team?
Getting your hands on Corsi data has never been easier, and you don’t need to open your wallet. Several fantastic public websites offer deep dives into the numbers for every NHL team and player.
The most trusted resources are free to use. Sites like Natural Stat Trick, Evolving-Hockey, and Hockey-Reference provide detailed breakdowns that let you see the game through an analyst's eyes. You can filter by game state (like 5-on-5), player, and specific date ranges to do your own digging.
Ready to explore these stats for yourself? PuckNStick offers detailed leaderboards and player comparison tools to help you track Corsi and other advanced metrics all season long. Start your analysis at PuckNStick.
Article created using Outrank